Contribute toward the service of truth and collective well-being. Click here

Contribute toward the service of truth and collective well-being. Click here
MISSION 1.5
AN INITIATIVE OF TATTVABODH TRUST

MISSION 1.5

Mission 1.5 is a time-bound commitment to protect life on Earth by preventing global warming from crossing the planet’s last safe climate limit—1.5°C. Scientists are clear: crossing this threshold by 2030 risks irreversible damage, triggering runaway feedback loops of melting glaciers, rising seas, and collapsing ecosystems. This is not a distant warning; it is a near-term deadline.

Our mission is rooted in one decisive insight: the planet’s disorder reflects the disorder within the human mind. Environmental collapse is not just a technological failure, but a human one— born from unchecked desire, overconsumption, and unconscious living.

Mission 1.5 exists to realign human action through awareness, responsibility, and conscious decision-making.

THE SIXTH MASS EXTINCTION

Five times in Earth’s history, life collapsed on a planetary scale. The last ended the age of the dinosaurs.

Scientists now warn that a sixth is unfolding—this time driven by human activity. Species are disappearing at rates hundreds of times faster than normal, and the ecosystems that regulate climate, food, and water systems are destabilizing.

Crossing the 1.5°C climate threshold accelerates this collapse. Rising temperatures intensify habitat loss,
ocean acidification, wildfires, and extreme weather—pushing already fragile systems beyond recovery.

Mission 1.5 exists to prevent that tipping point from becoming permanent.

"Climate collapse is the outer expression of humanity’s inner collapse."

Mission 1.5 is a time-bound commitment to protect life on Earth by preventing global warming from crossing the planet’s last safe climate limit—1.5°C. Scientists are clear: crossing this threshold by 2030 risks irreversible damage, triggering runaway feedback loops of melting glaciers, rising seas, and collapsing ecosystems. This is not a distant warning; it is a near-term deadline.

Our mission is rooted in one decisive insight: the planet’s disorder reflects the disorder within the human mind. Environmental collapse is not just a technological failure, but a human one— born from unchecked desire, overconsumption, and unconscious living.

Mission 1.5 exists to realign human action through awareness, responsibility, and conscious decision-making.

“The climate does not need fixing. Consciousness does.”

THE COST OF A WARMING PLANET

Melting Glaciers
Floods
Wildfires
Droughts
Melting glaciers are shrinking long-term freshwater reserves, destabilizing mountain and polar ecosystems, altering river flows that support drinking water, agriculture, and hydropower, and accelerating global sea-level rise. As ice disappears, cold-adapted species lose habitat, downstream flooding increases, dry-season water shortages intensify, and entire ecological and human systems that depend on predictable melt cycles begin to fail.

Source: science.nasa.gov
Before
After
Flooding driven by extreme rainfall, glacier melt, and rising seas is destroying homes, infrastructure, crops, and livelihoods while contaminating freshwater sources, disrupting economies, spreading water-borne diseases, eroding soils, and displacing millions. Floodwaters fragment habitats, drown terrestrial species, disrupt breeding cycles, and collapse local ecosystems, with the heaviest impacts falling on vulnerable communities and low-lying regions.

Source: science.nasa.gov
Before
After
Wildfires are growing more frequent and intense, wiping out forests, wildlife, and human settlements while releasing massive amounts of stored carbon and toxic air pollutants into the atmosphere. Beyond immediate destruction, fires degrade soil health, reduce biodiversity, disrupt food webs, threaten species with local extinction, and increase long-term risks of flooding, landslides, and ecosystem collapse.

Source: science.nasa.gov
Before
After
Droughts are exhausting water supplies, collapsing agricultural systems, reducing food and energy security, degrading soils, accelerating desertification, and driving heat stress, migration, and conflict. Prolonged dryness destroys habitats, kills vegetation, pushes species beyond survival thresholds, reduces ecosystem resilience, and weakens the natural systems that regulate climate, water cycles, and life itself.

Source: science.nasa.gov
Before
After

“Climate crisis is not carbon. It is consciousness fragmented into ME and WORLD.”

THE SILENT COLLAPSE OF LIFE

In just 50 years, human activity has reshaped the planet at an unprecedented scale. Across oceans, forests, and plains, populations of animals, plants, fungi, and trees are plummeting at alarming rates, while millions of species teeter on the brink of extinction. This decline is not just numbers on a chart — it is a warning that the delicate web of life sustaining humanity is unraveling. Every lost species, every vanishing forest, every shrinking habitat brings us closer to a future impoverished in biodiversity and resilience. Our choices today will determine whether Earth remains a thriving home for life or a monument to what we failed to protect.

THE NUMBERS:

•Overall global decline in monitored vertebrate populations: 73 %
•Freshwater vertebrate species decline: 85 %
•Terrestrial (land) vertebrate species decline: 69 %
•Marine vertebrate species decline: 56 %
•Total vertebrate species analyzed (LPI): ~5,495
•Total vertebrate population trends tracked: ~35,000
•Estimated portion of vertebrate population decline attributed to human activity (habitat loss, overexploitation, pollution): ~60–70 %
•Estimated portion of decline attributed specifically to climate change: ~10–15 % of global vertebrate declines
•Total species assessed by IUCN Red List: ~172,620
•Species threatened with extinction (all groups): 48,646 (~28% of assessed species)
•Estimated total species at risk globally: ~1 million
•Mammals threatened: 27 %
•Birds threatened: 11.5 %
•Reptiles threatened: 21 %
•Amphibians threatened: 41 %

•Freshwater fish threatened: 26 %
•Sharks & rays threatened: 38 %
•Reef-forming corals threatened: 44 %
•Flowering plants threatened: 58 %
•Conifers (trees) threatened: 34 %
•Fungi threatened: ~33 %
•Global tree cover lost since 2000: ~488 million hectares (~12 % of 2000 cover)
•Annual tree cover loss (2023): ~28.3 million hectares
•Permanent deforestation since 2000: 37 % of tree cover loss
•Primary forest loss in 2024: 6.7 million hectares
•Key biodiversity forest areas lost tree cover in 2024: ~2.2 million hectares
•Number of tree species assessed: ~17,393 species (~54 % exposed to high or increasing threats)
•Estimated portion of plant and tree species decline caused by human-driven land use change: ~60 %
•Estimated portion of plant and tree species decline caused by climate change: ~8–12 %

“The Earth is not heated by carbon alone, but by the fever of endless becoming.”

SCIENTIFIC DATA & EVIDENCE OVER THE YEARS

429 PPM
February 2026 data

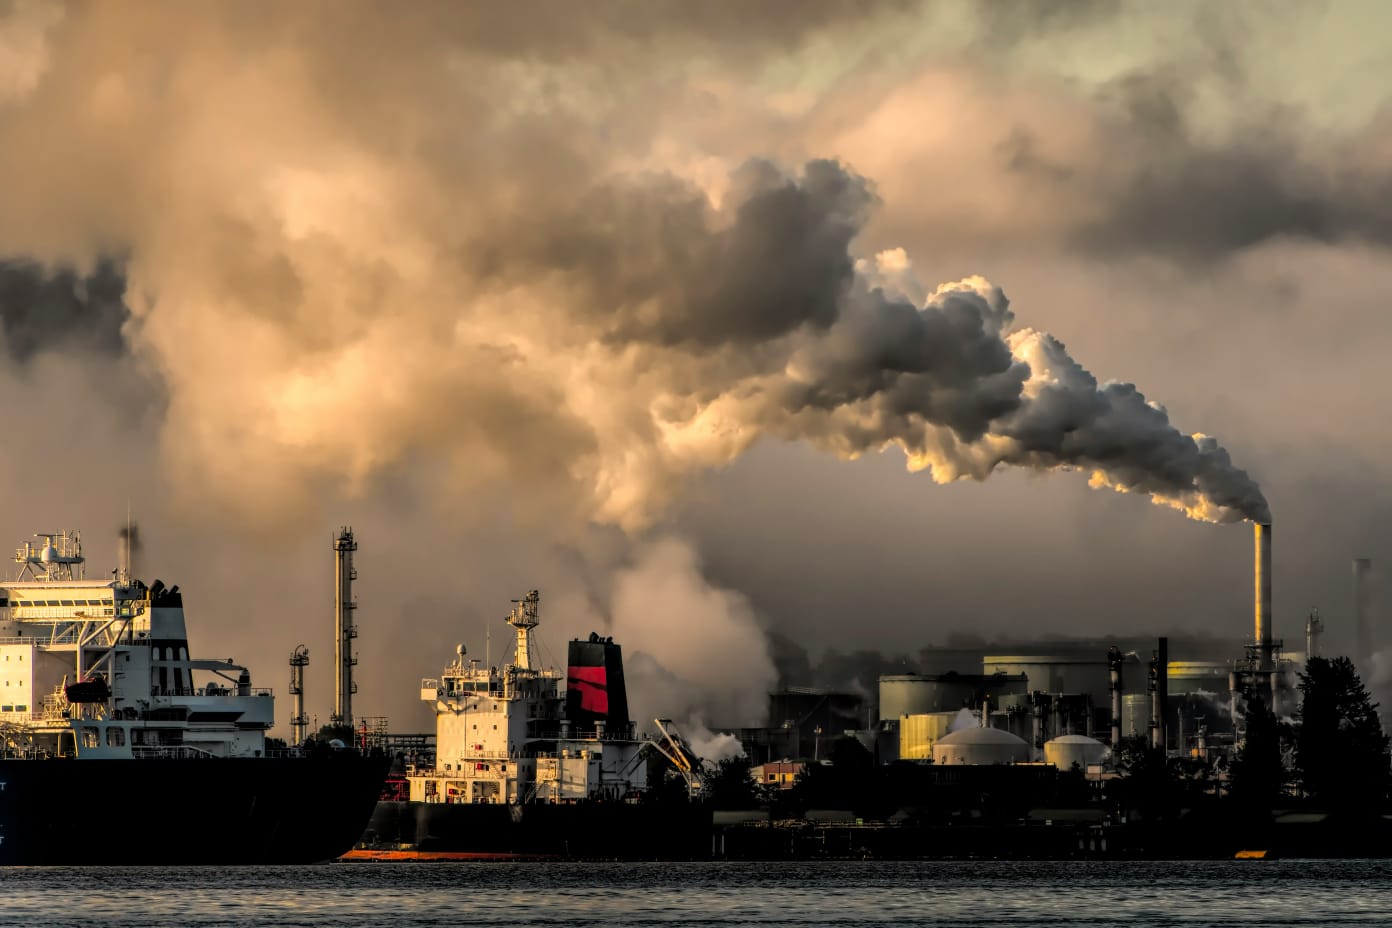
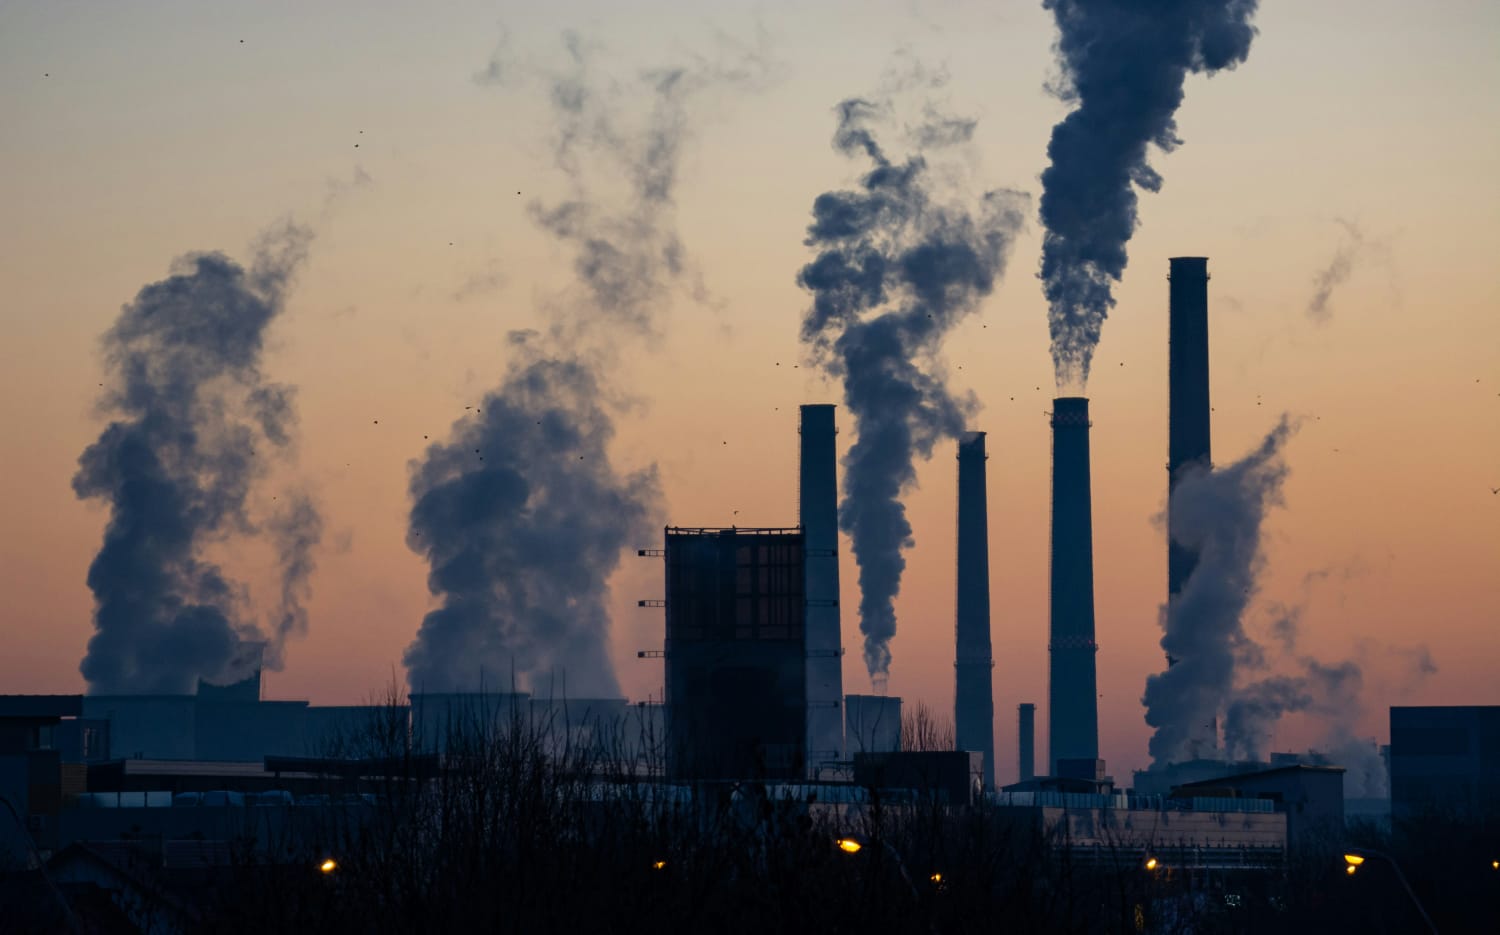
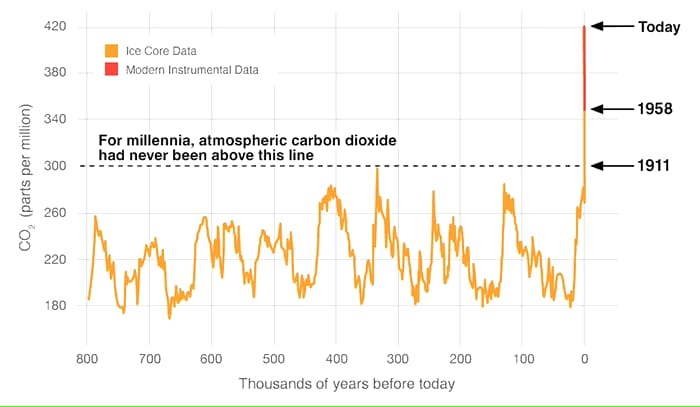
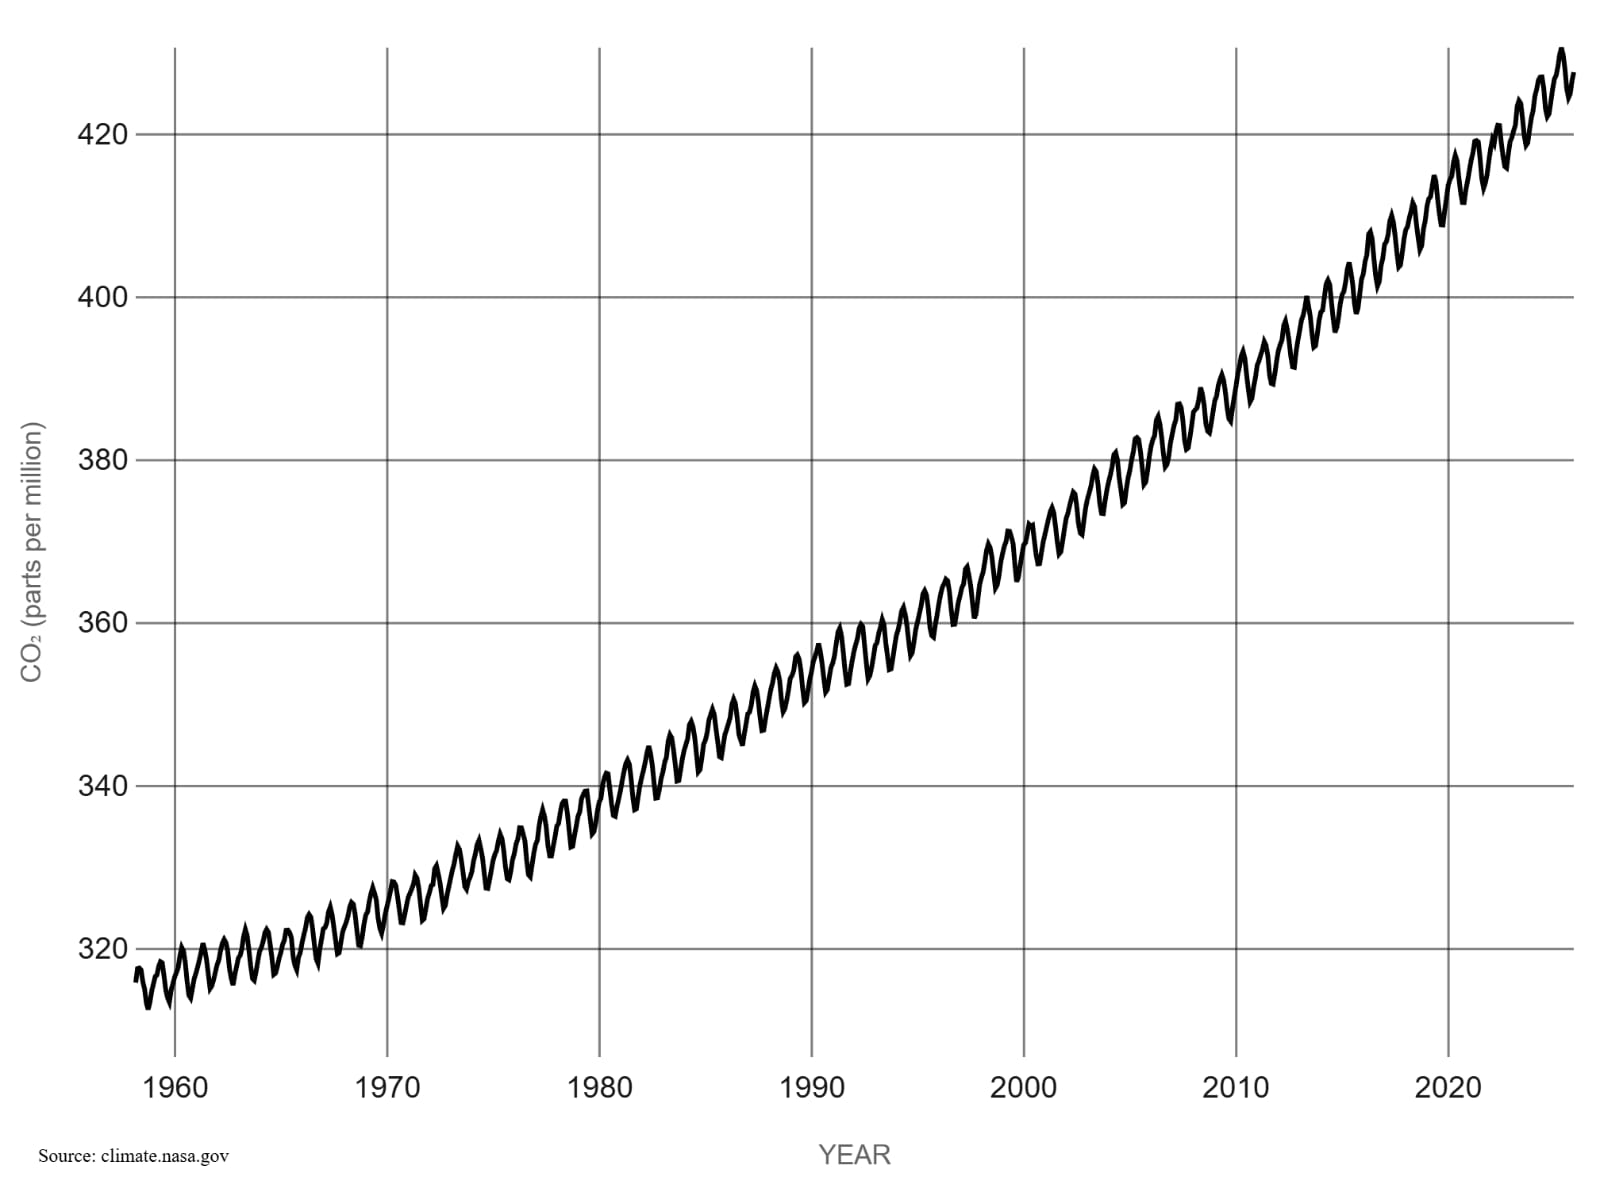
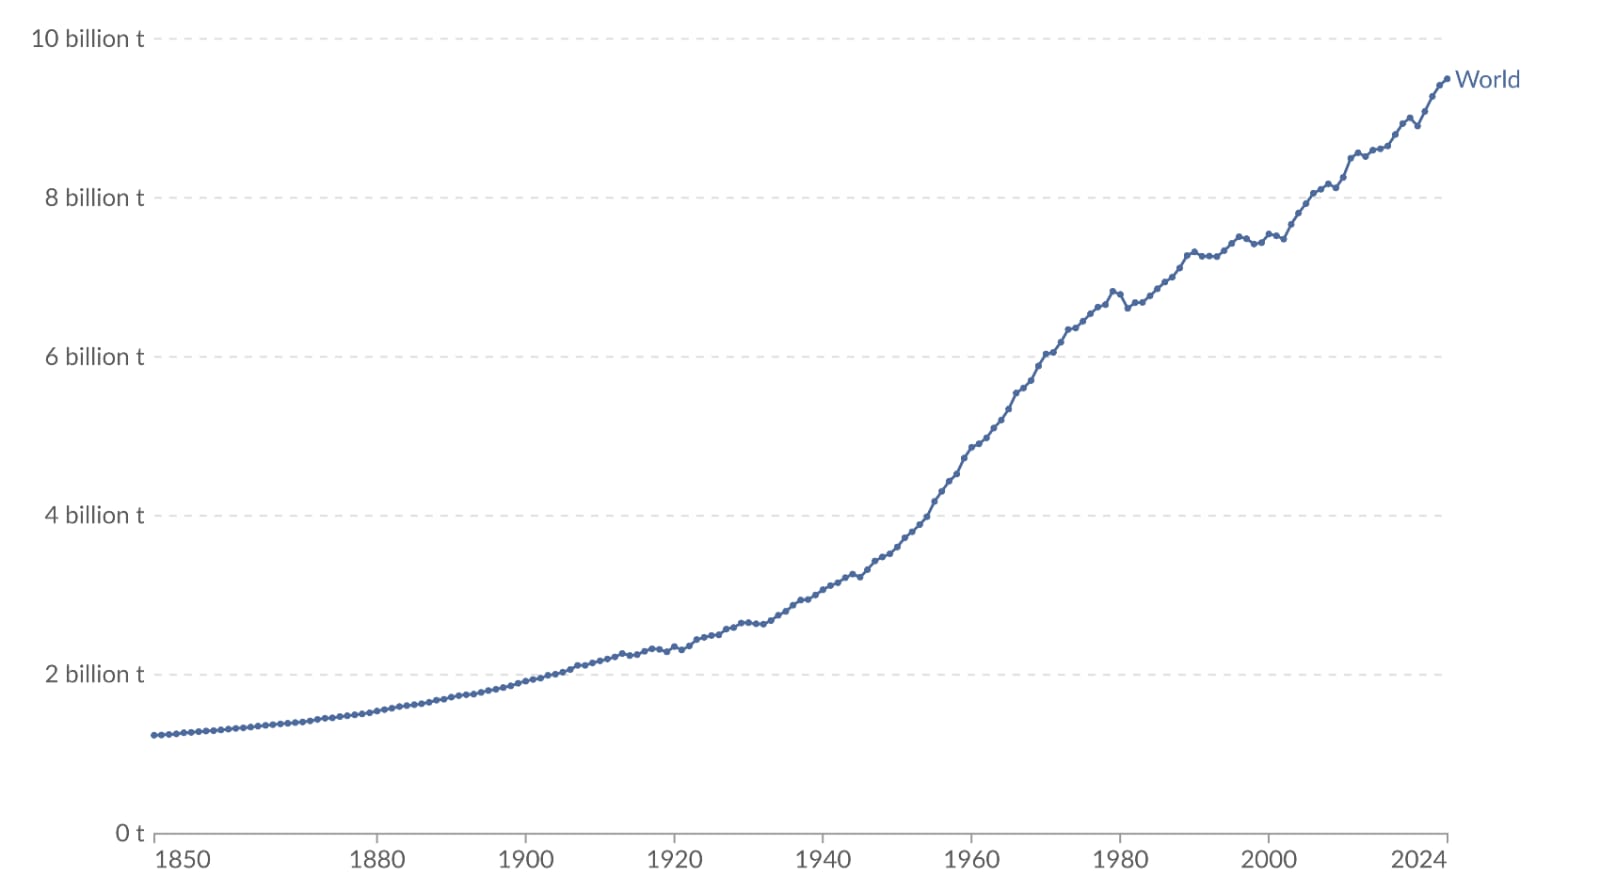
Carbon dioxide (CO2) is the primary greenhouse gas emitted by human activities. It accumulates in the atmosphere for centuries, trapping heat and driving long-term global warming and climate disruption.

THE NUMBERS:
  • 429 ppm CO2 in the atmosphere – highest level in ~2 million years
  • 280 ppm -> 420 ppm since pre-industrial times – a ~50% increase caused by human activity
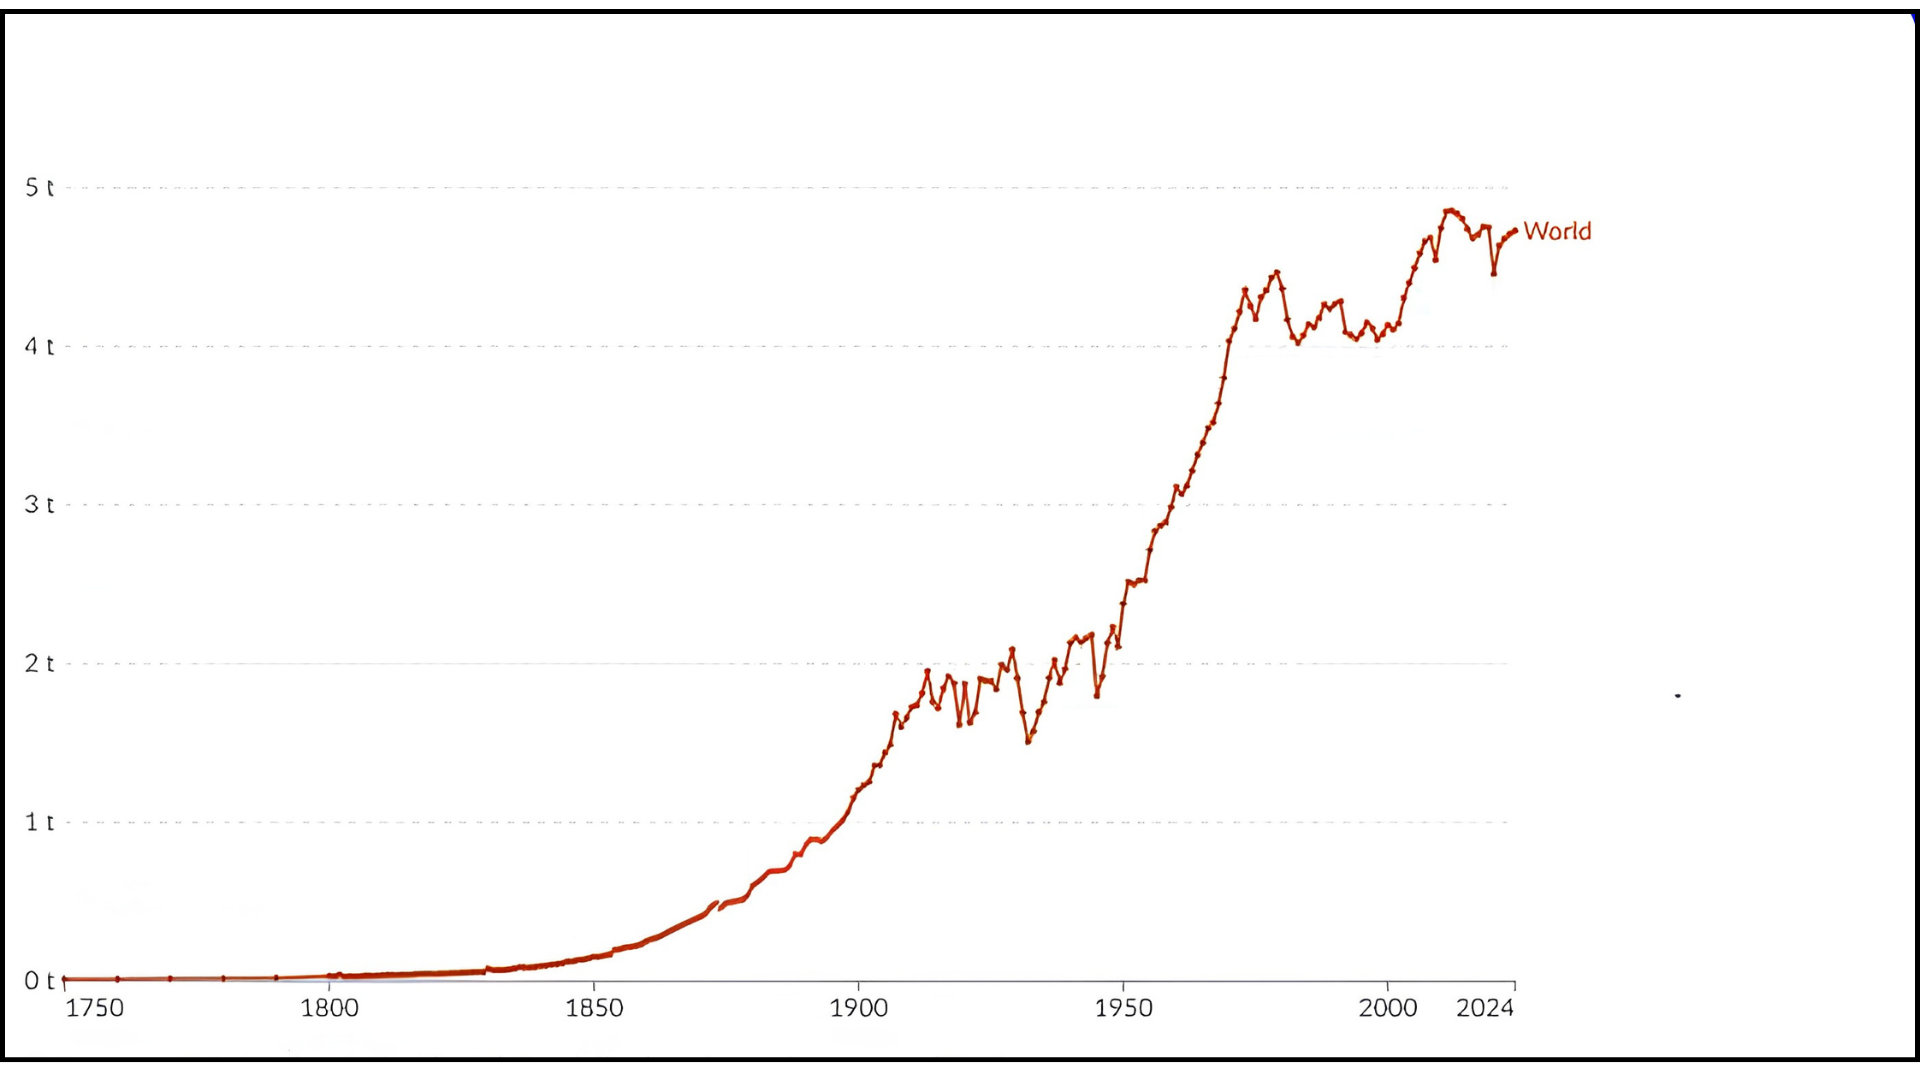
  • ~37 billion tonnes of CO2 emitted annually from fossil fuels
  • ~75% of total global greenhouse gas emissions are CO2
  • Responsible for ~65% of human-caused global warming
  • CO2 remains in the atmosphere for 300–1,000+ years, locking in warming
  • Doubling CO2 ≈ +3°C global temperature rise
  • CO2 is rising ~10× faster than natural increases after the last ice age
  • Humans emit ~100× more CO2 per year than all volcanoes combined (USGS)
1946 PPB
November 2025 data

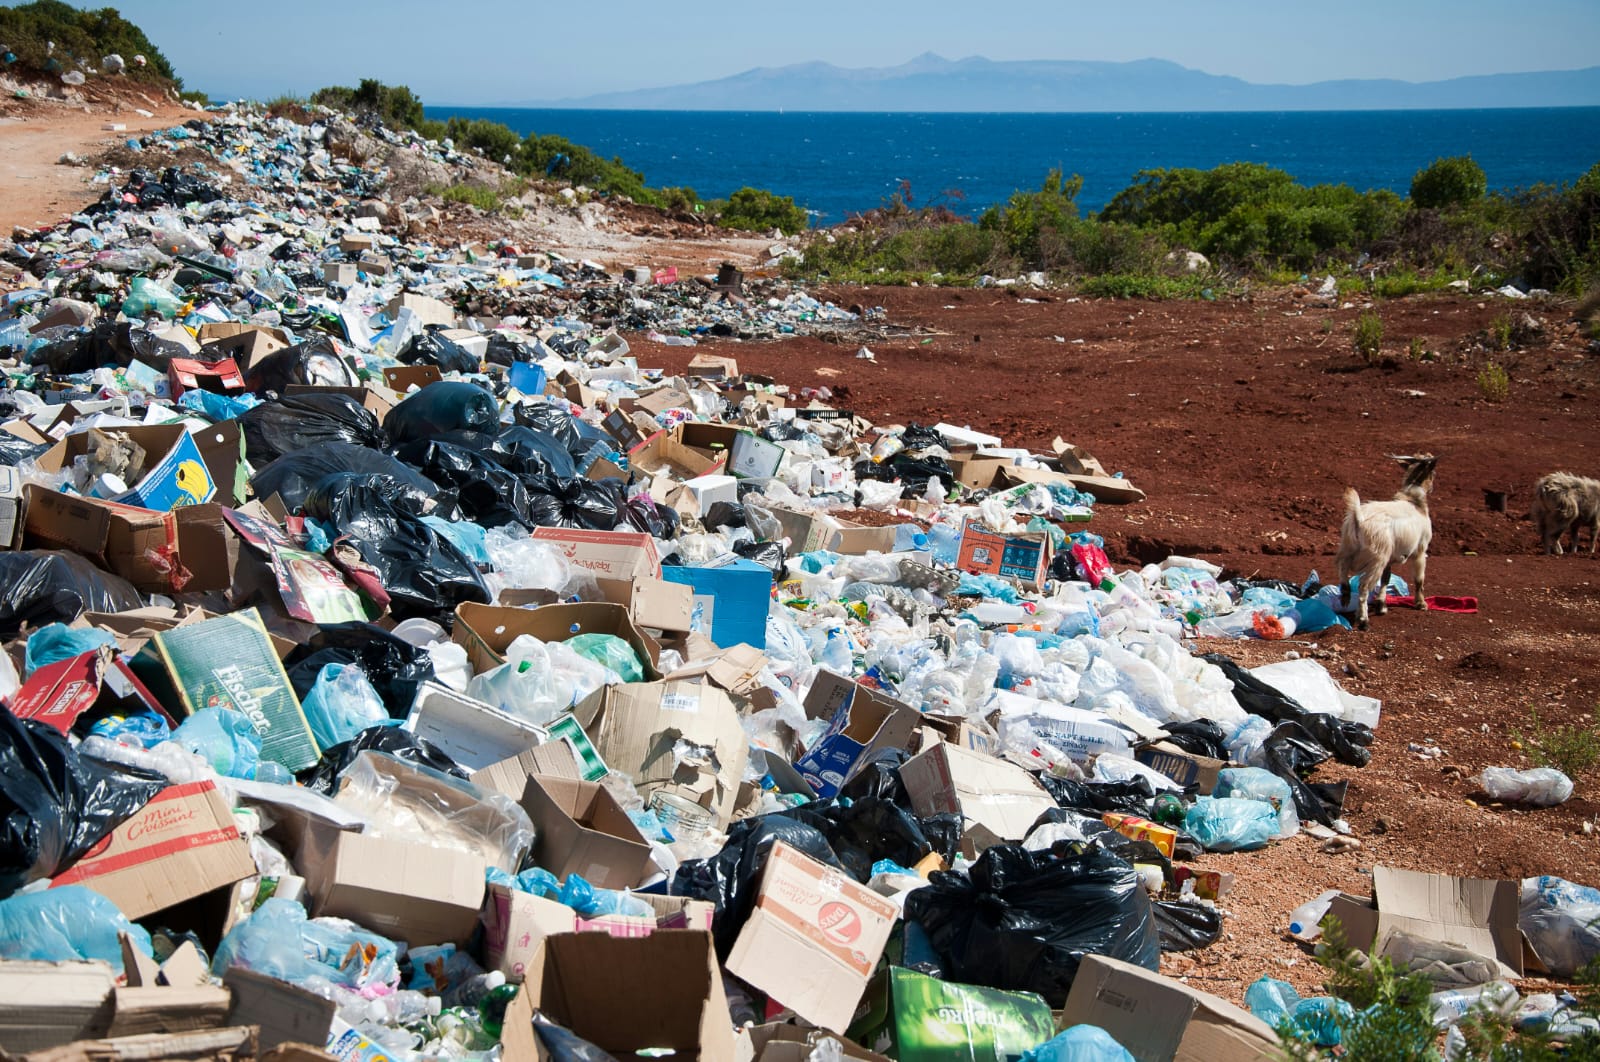
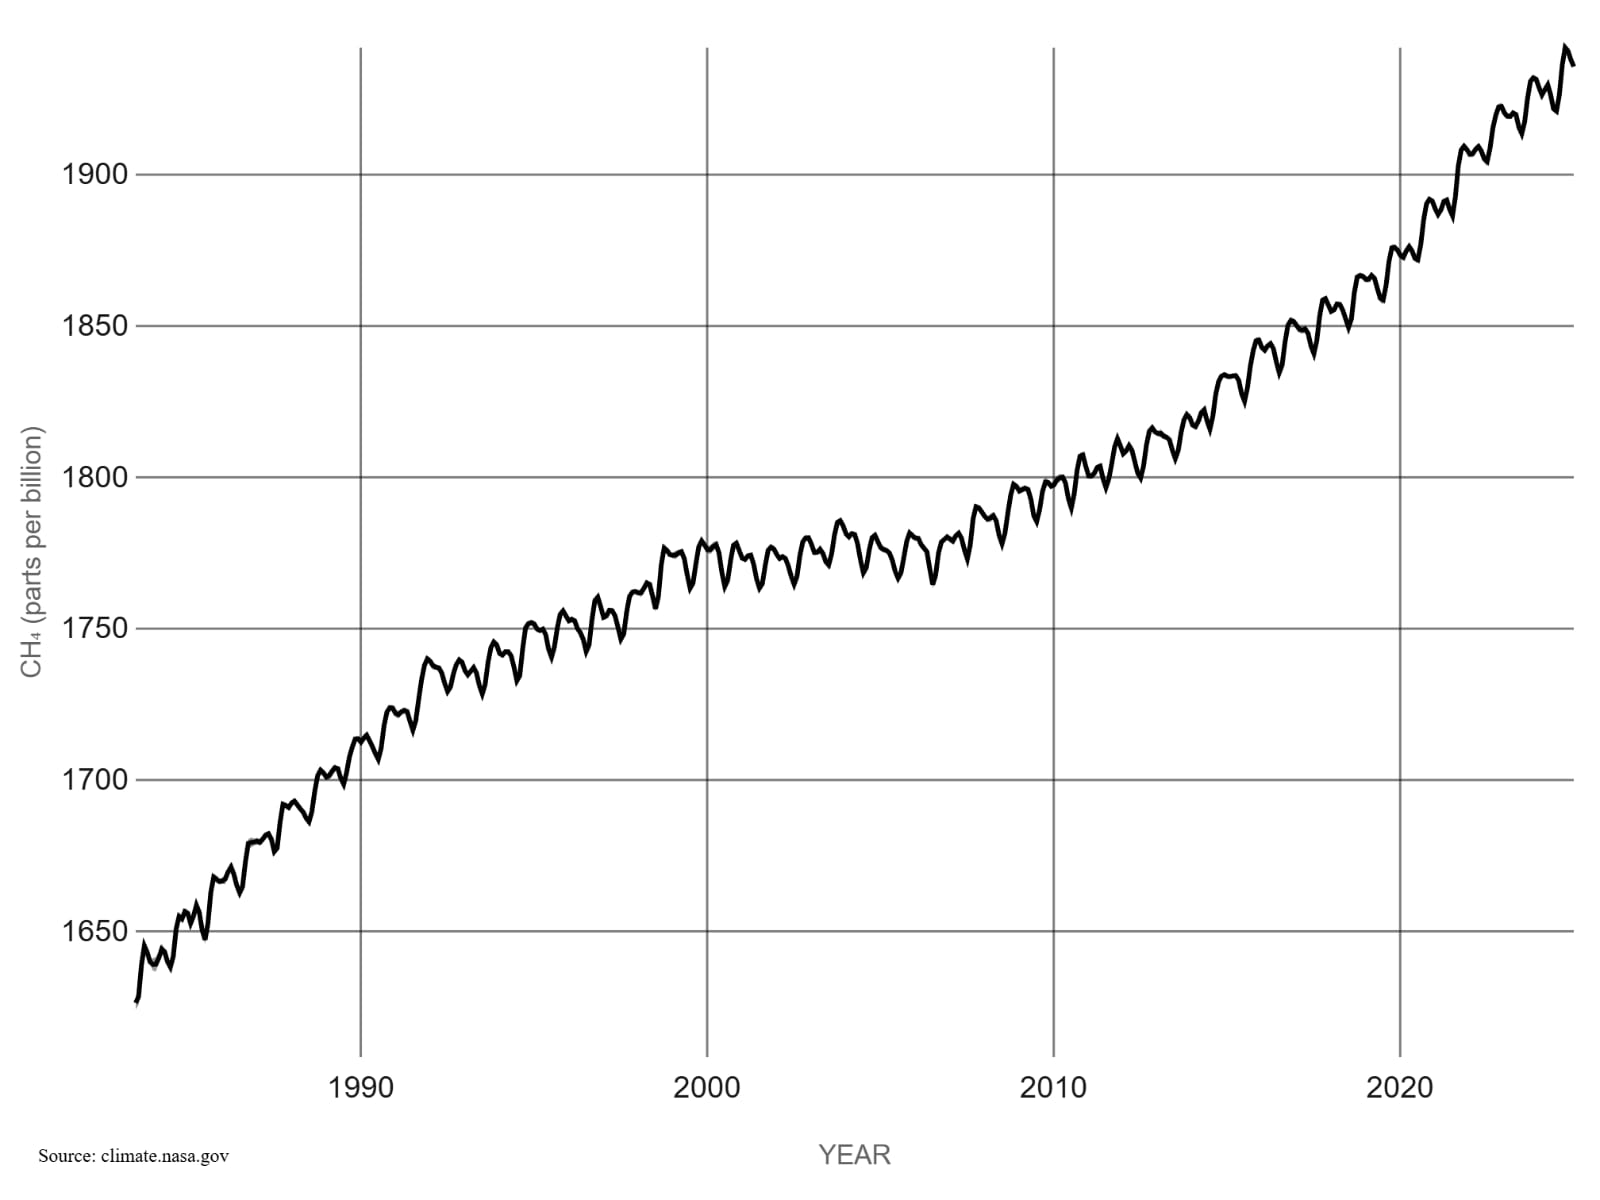
Methane (CH4) is a powerful greenhouse gas released from fossil fuel extraction, agriculture, landfills, and natural systems. Though it stays in the atmosphere for a shorter time than CO2, it traps far more heat, making it a major driver of near-term global warming.

THE NUMBERS:
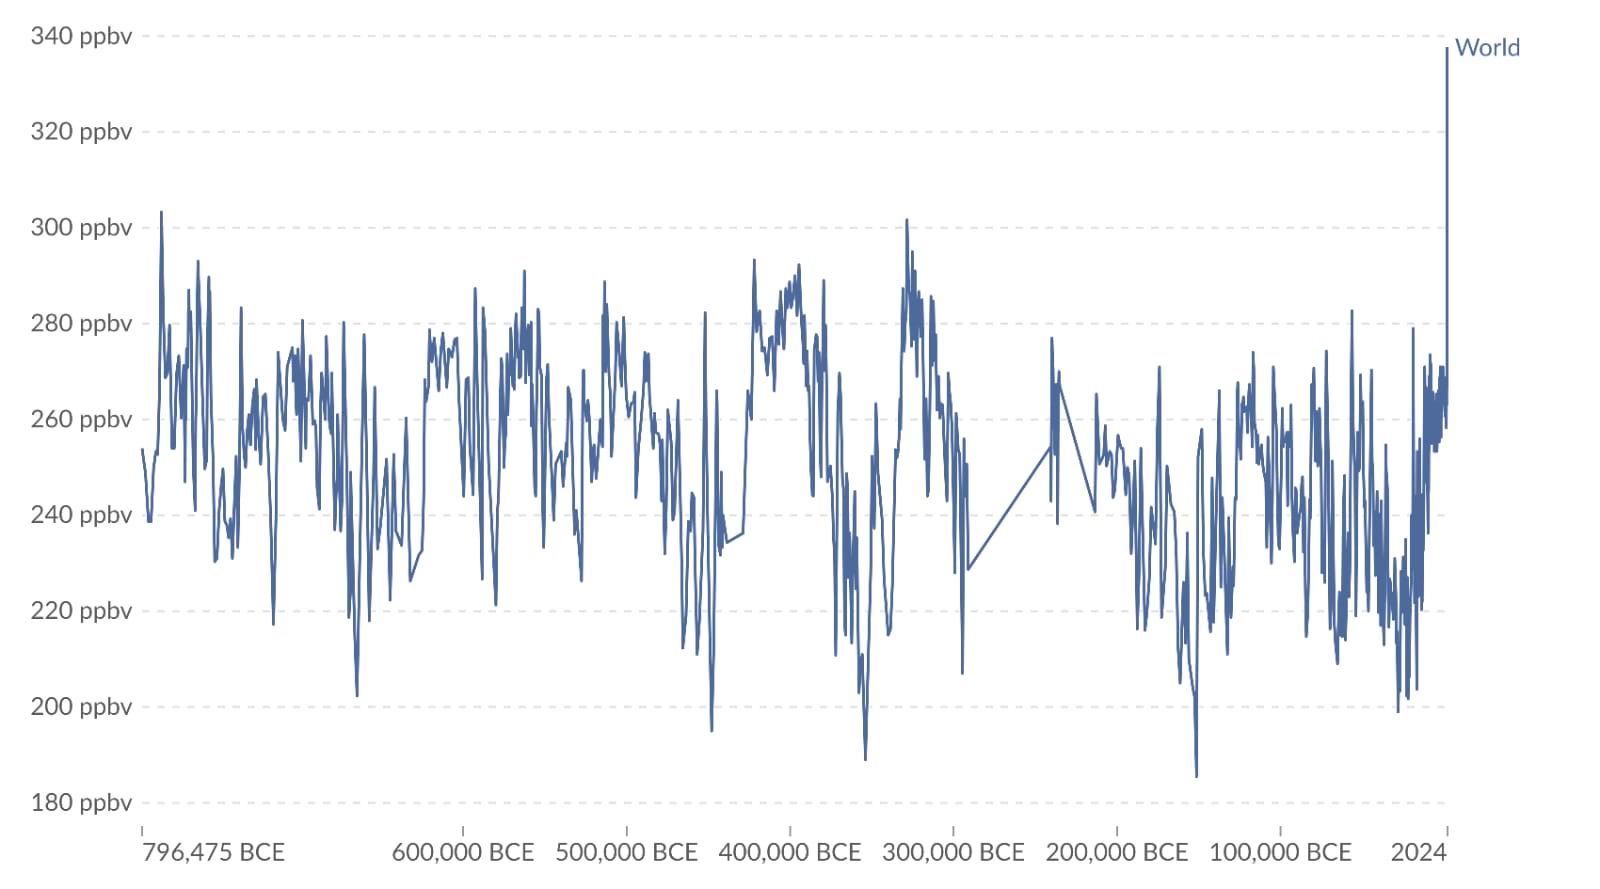
  • ~1,946 ppb methane in the atmosphere – highest level in at least 800,000 years
  • ~2.6× increase since pre-industrial levels (~700 ppb)
  • Methane is ~84× more powerful than CO2 over a 20-year period
  • ~30% of current global warming is driven by methane
  • Atmospheric lifetime: ~12 years, making reductions highly effective
  • ~60% of methane emissions come from human activities
  • Major human sources: fossil fuels (~35%), agriculture (~40%), waste (~20%)
  • Cutting methane could reduce warming by ~0.3°C by 2040
336 PPB
September 2025 data

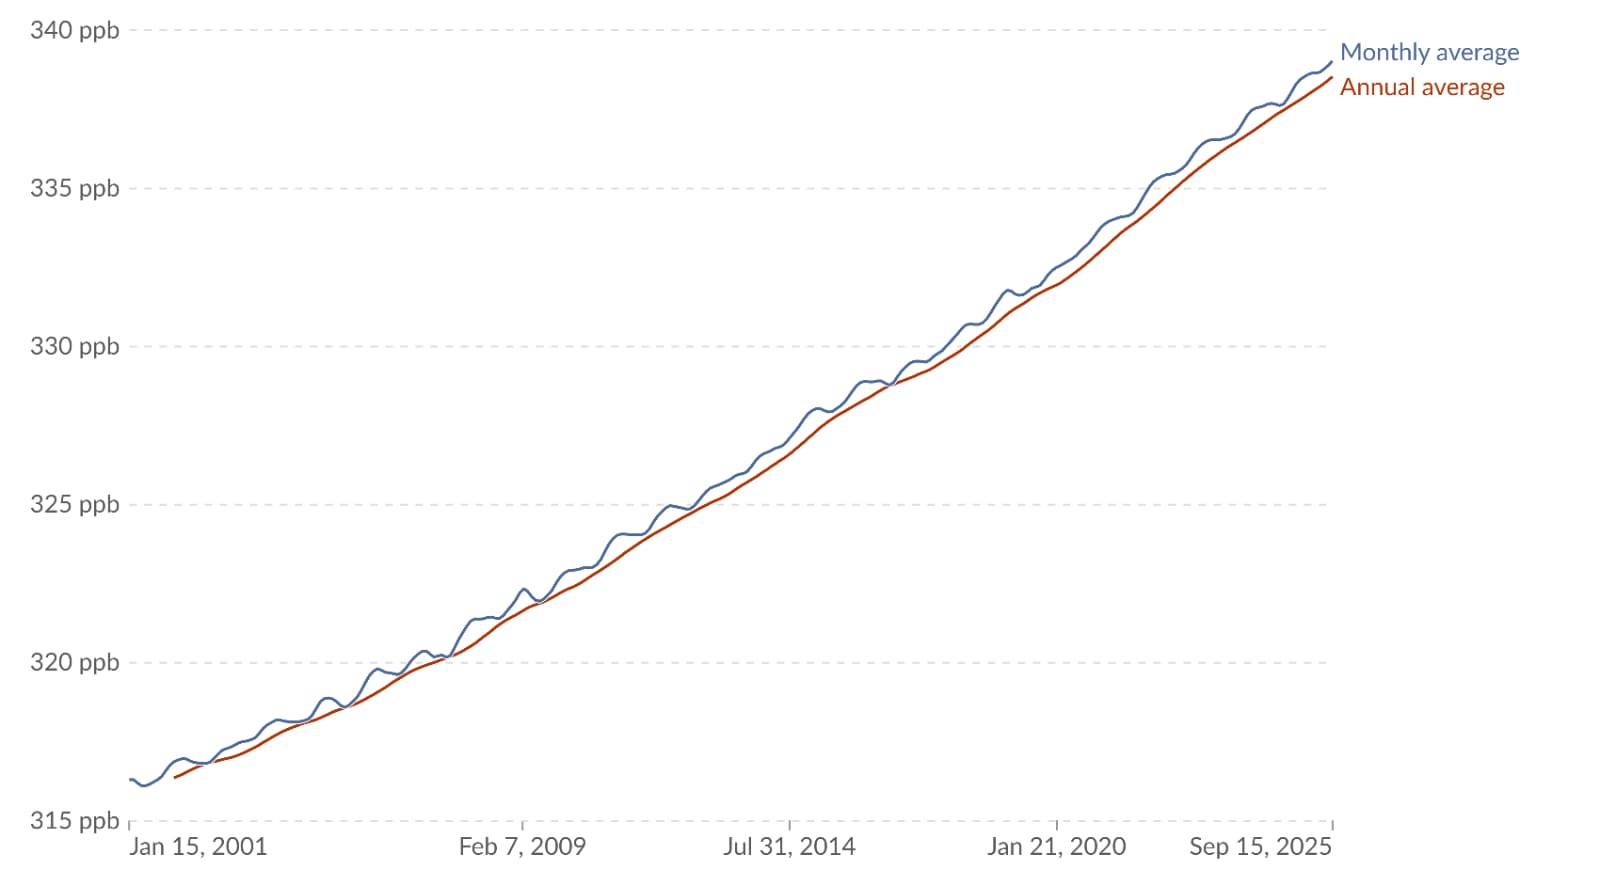
Nitrous oxide (N2O) is a long-lived, highly potent greenhouse gas released mainly from agricultural activities, especially fertilizer use. Though emitted in smaller amounts than CO2 or methane, it has a powerful warming effect and persists for over a century.

THE NUMBERS:
  • Atmospheric N2O concentration: ~336 ppb – highest level in at least 800,000 years
  • Increase since pre-industrial levels (~270 ppb): ~25% rise
  • N2O is ~273× more powerful than CO2 over a 100-year period
  • Atmospheric lifetime: ~110–120 years
  • Accounts for ~6–7% of total global greenhouse gas emissions
  • ~75% of global N2O emissions come from agriculture, mainly synthetic fertilizers and manure
  • N2O is now the largest remaining ozone-depleting substance emitted by human activities
  • Global N2O emissions have increased by ~30% since the 1980s (Global Carbon Project)
  • N2O warming effects are effectively irreversible on human timescales due to its long lifetime
1.47°C
warmer than preindustrial average
July 2025 data

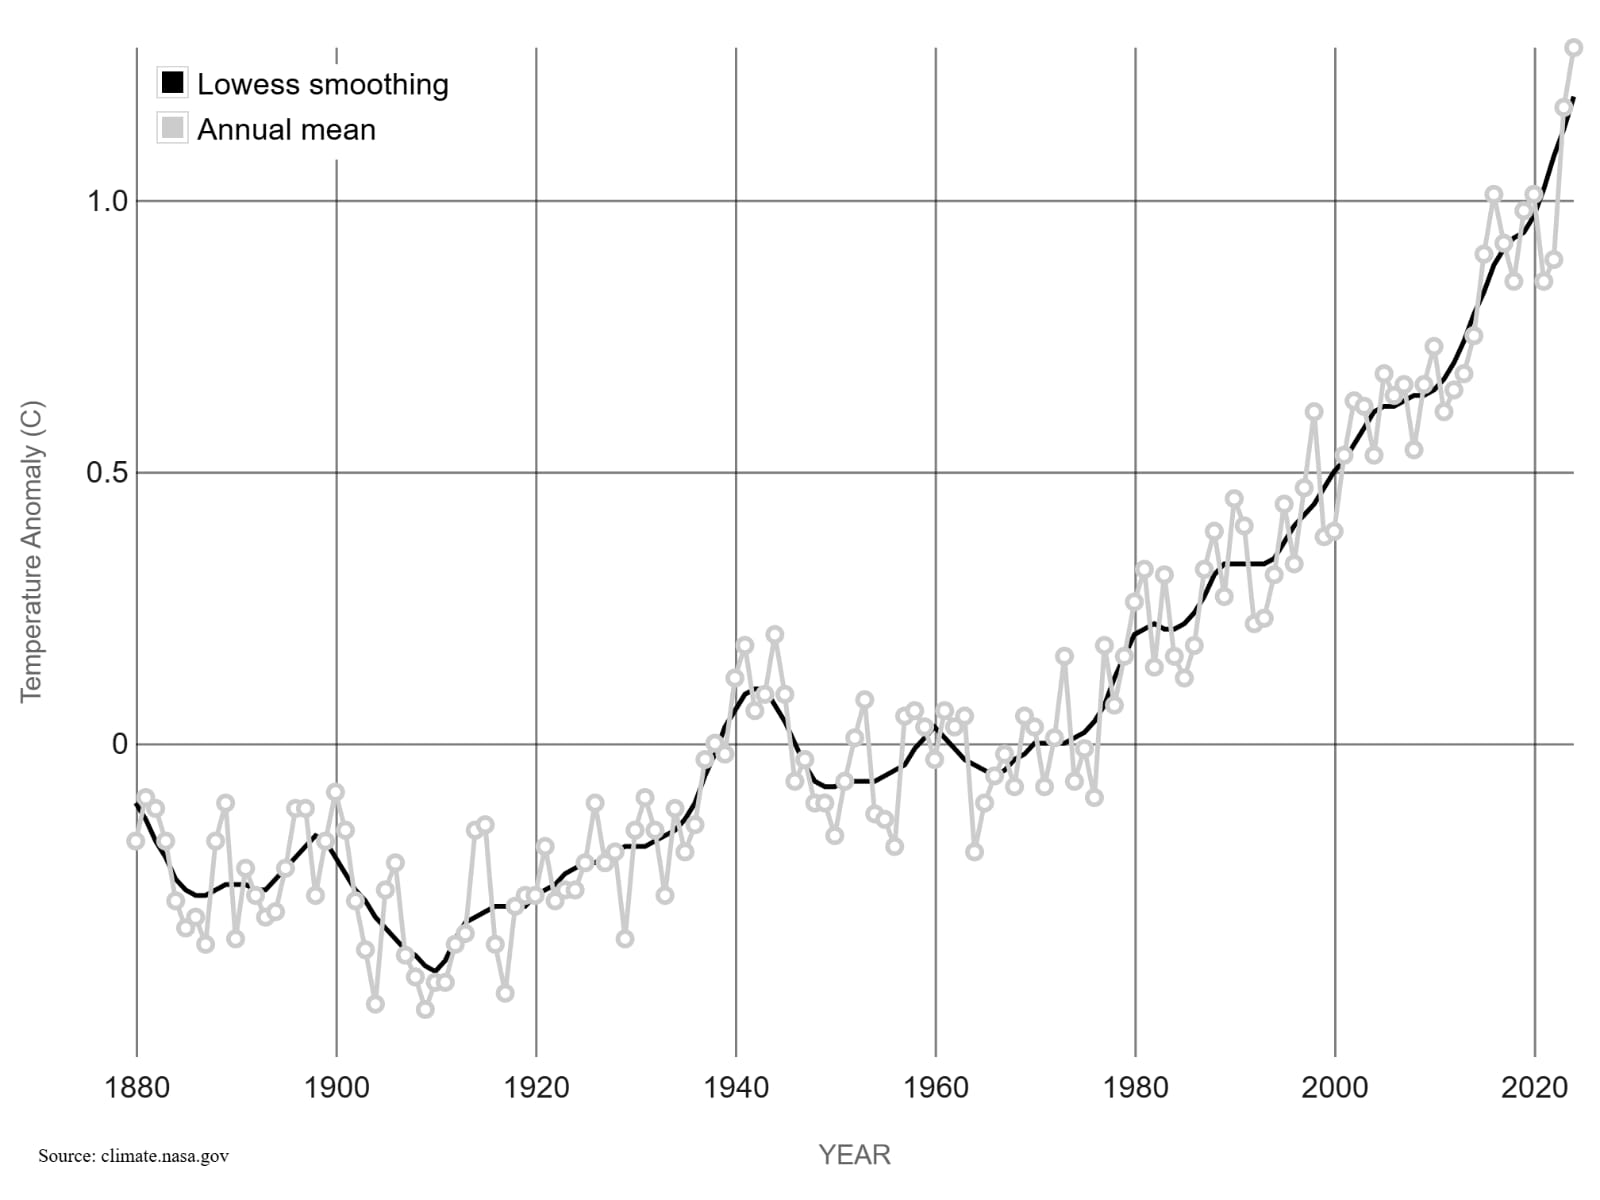
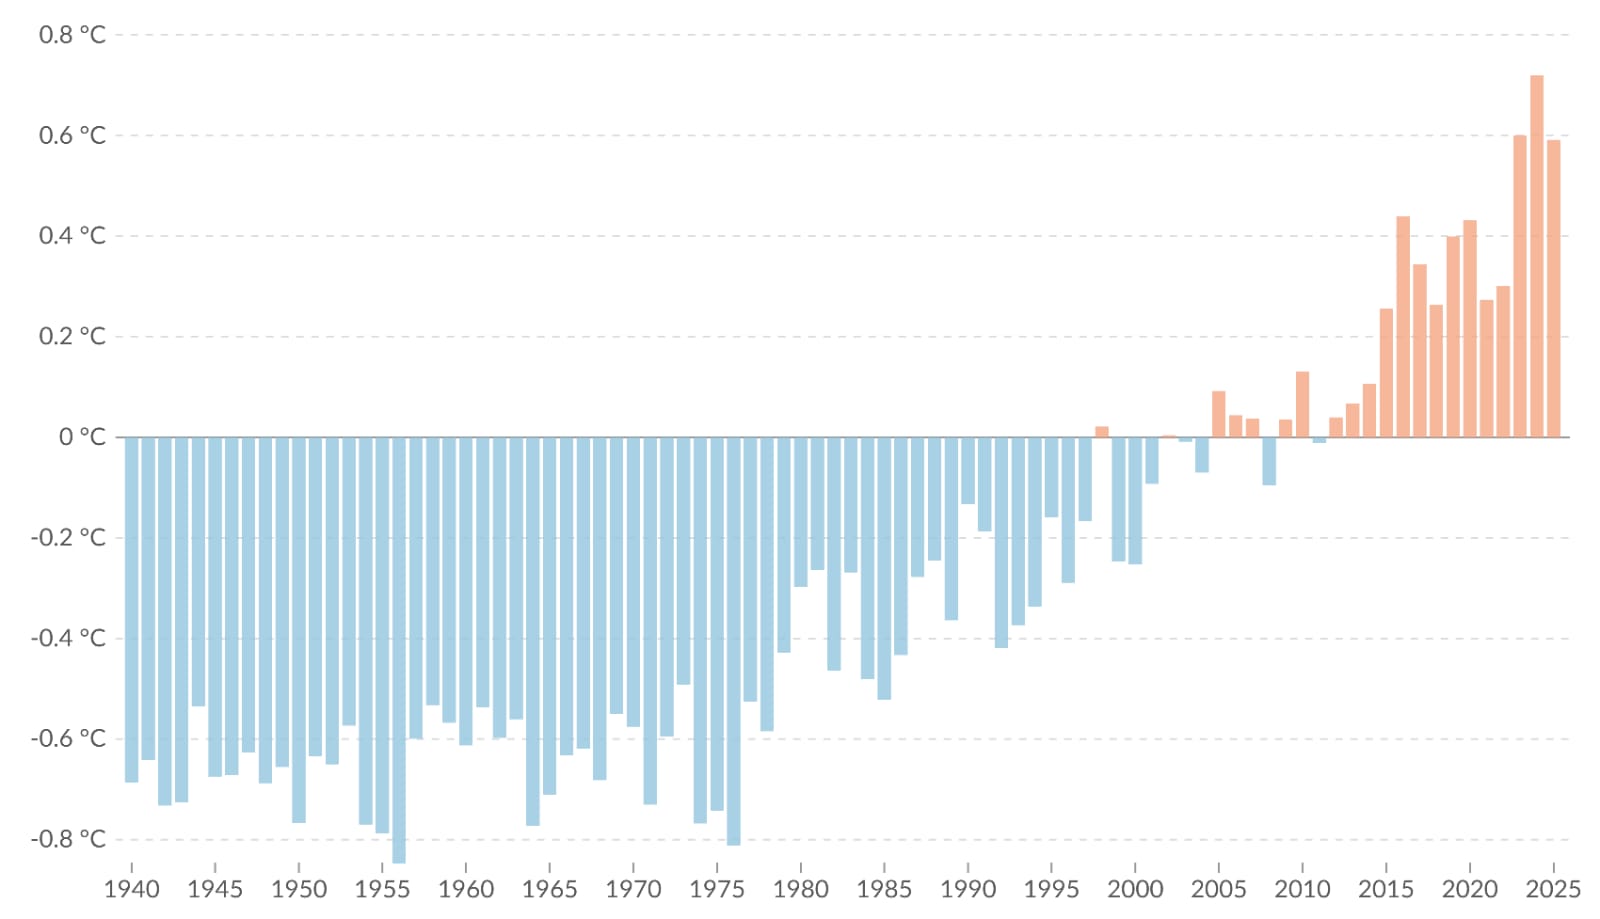
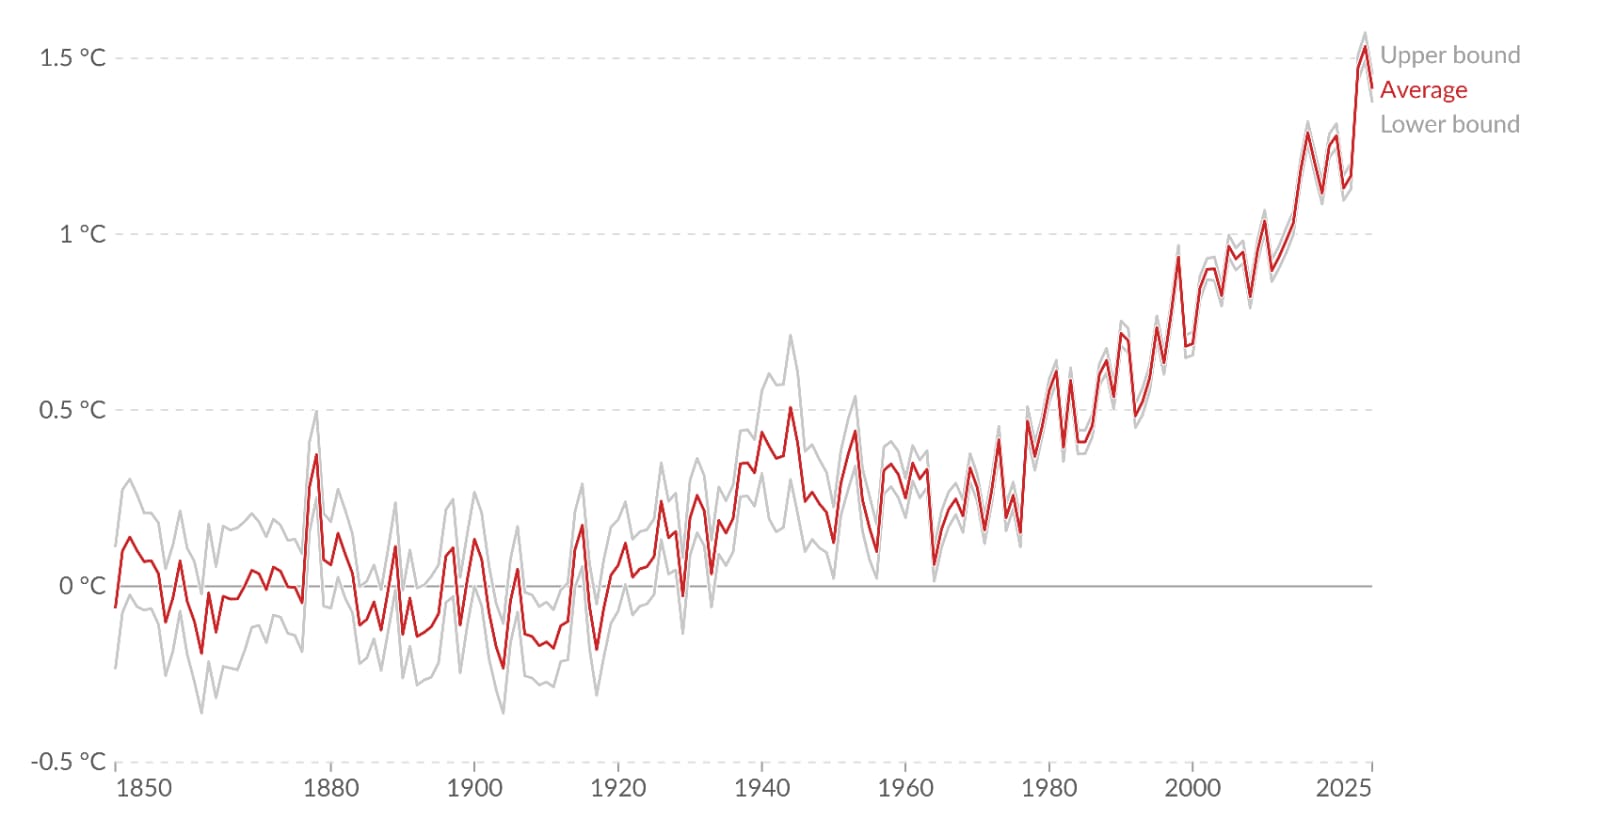
Global temperature reflects the average heat of Earth’s surface, oceans, and atmosphere. Rising global temperatures are the clearest indicator of climate change, driven primarily by human-caused greenhouse gas emissions.

THE NUMBERS:
  • Global average temperature has risen ~1.2–1.3°C above pre-industrial levels
  • 2024 was the hottest year on record, reaching 1.55°C above pre-industrial levels
  • The last 10 years (2015–2024) were the warmest ever recorded
  • Earth is warming at a rate of ~0.2°C per decade
  • 2024 was the first full calendar year to exceed 1.5°C above pre-industrial levels (WMO/Copernicus)
  • Warming over land is ~2× faster than the global average
  • The Arctic is warming ~4× faster than the global mean
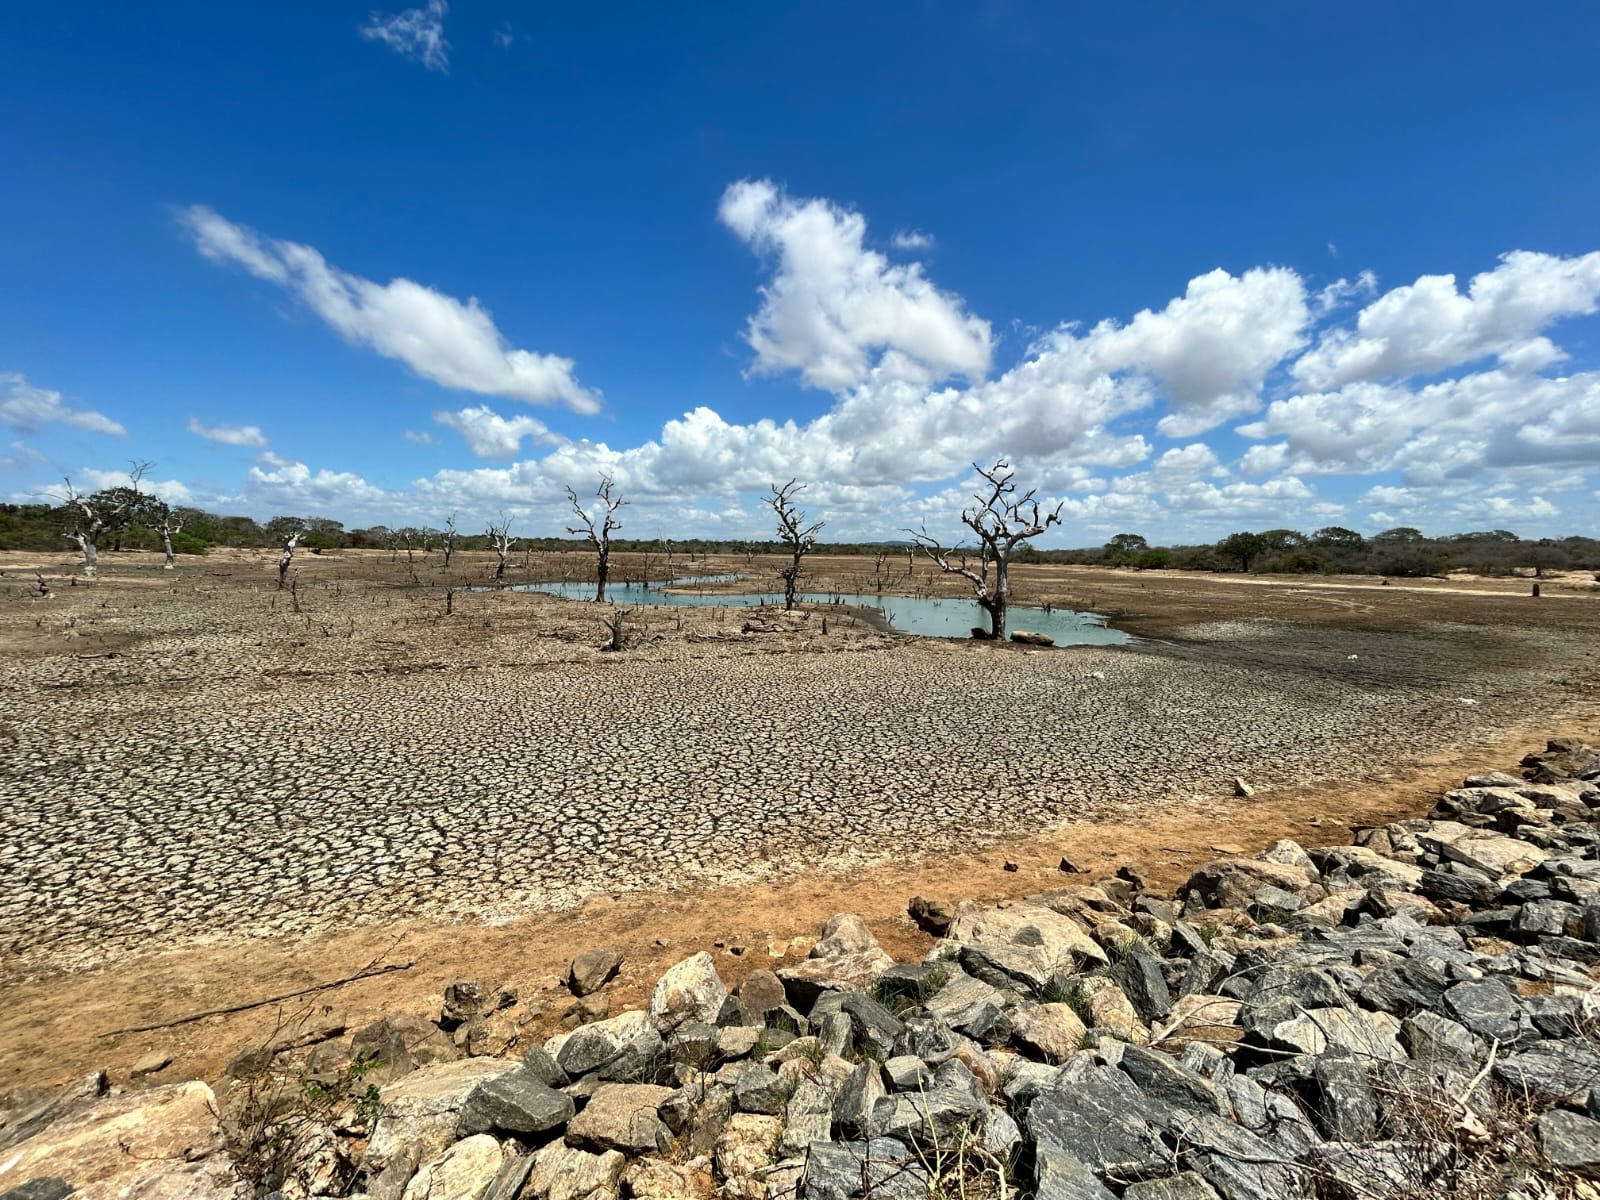
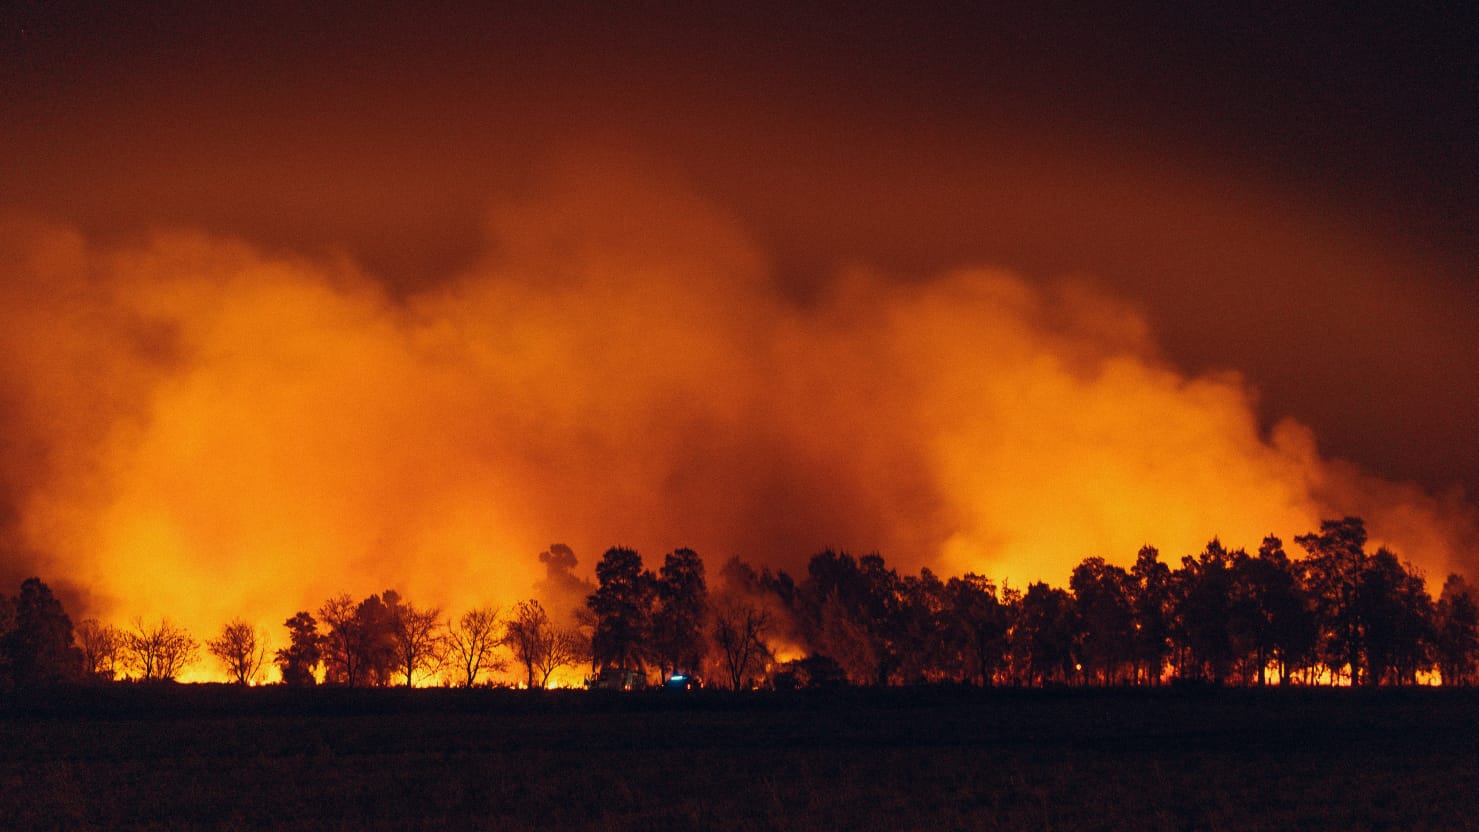
  • Each additional 0.1°C increases risks of extreme heat, floods, droughts, and wildfires
  • Without deep emissions cuts, warming is projected to reach ~2.5–3°C by 2100
135 BMT
per year since 2002
Rate of change per year-June 2025 data

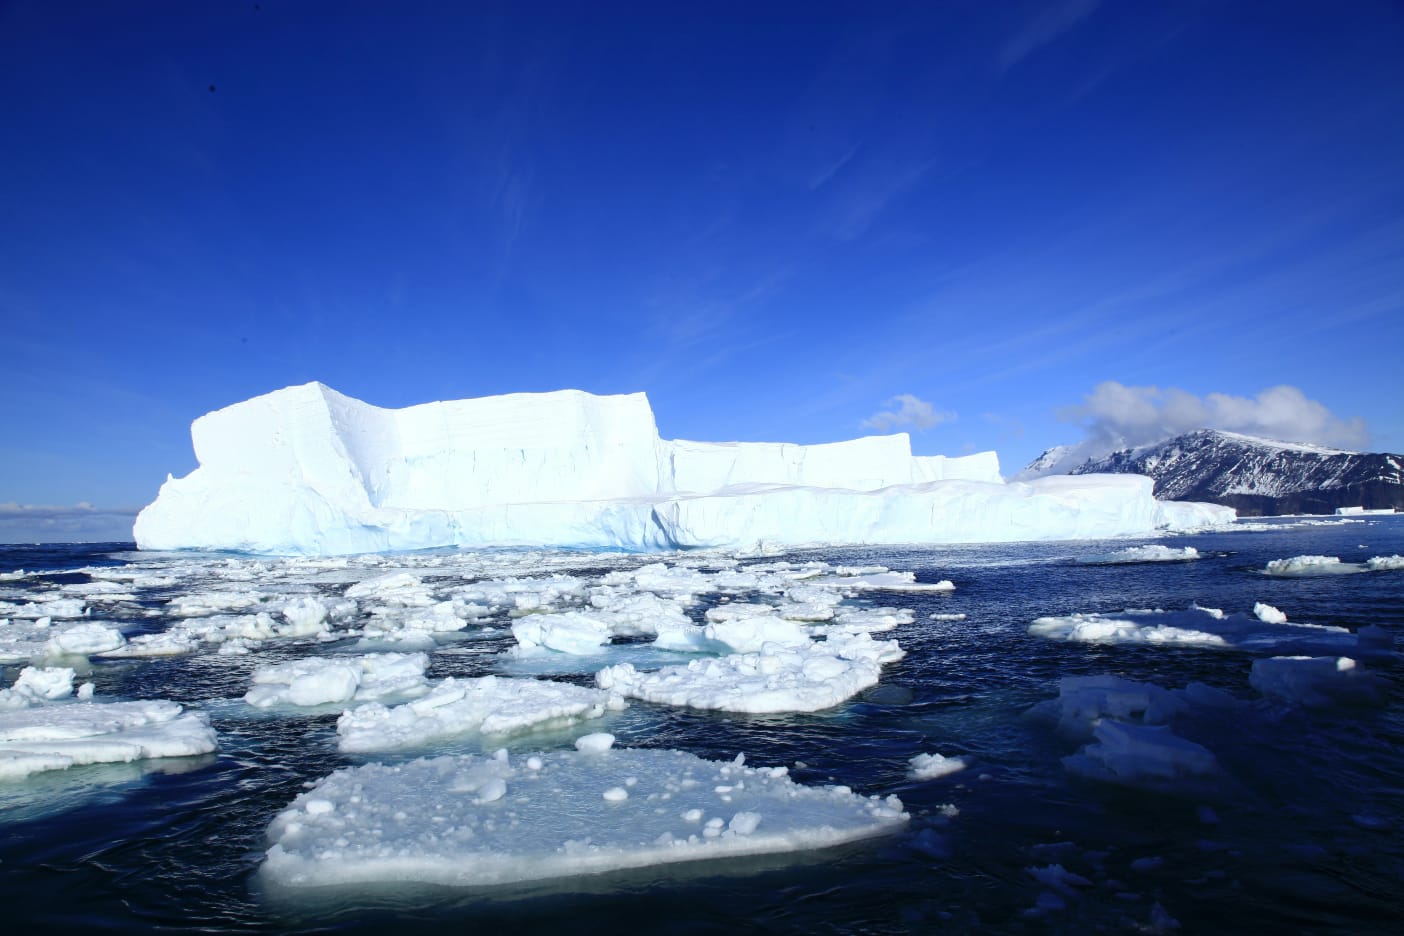
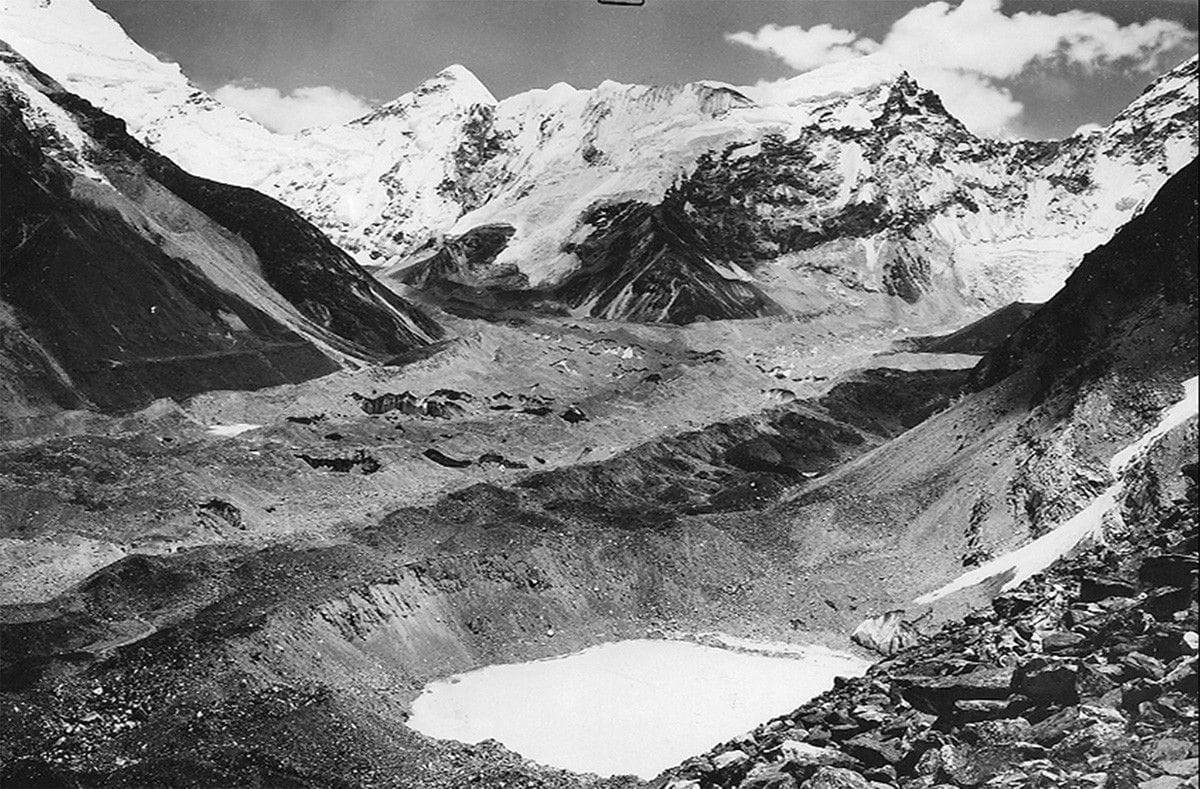
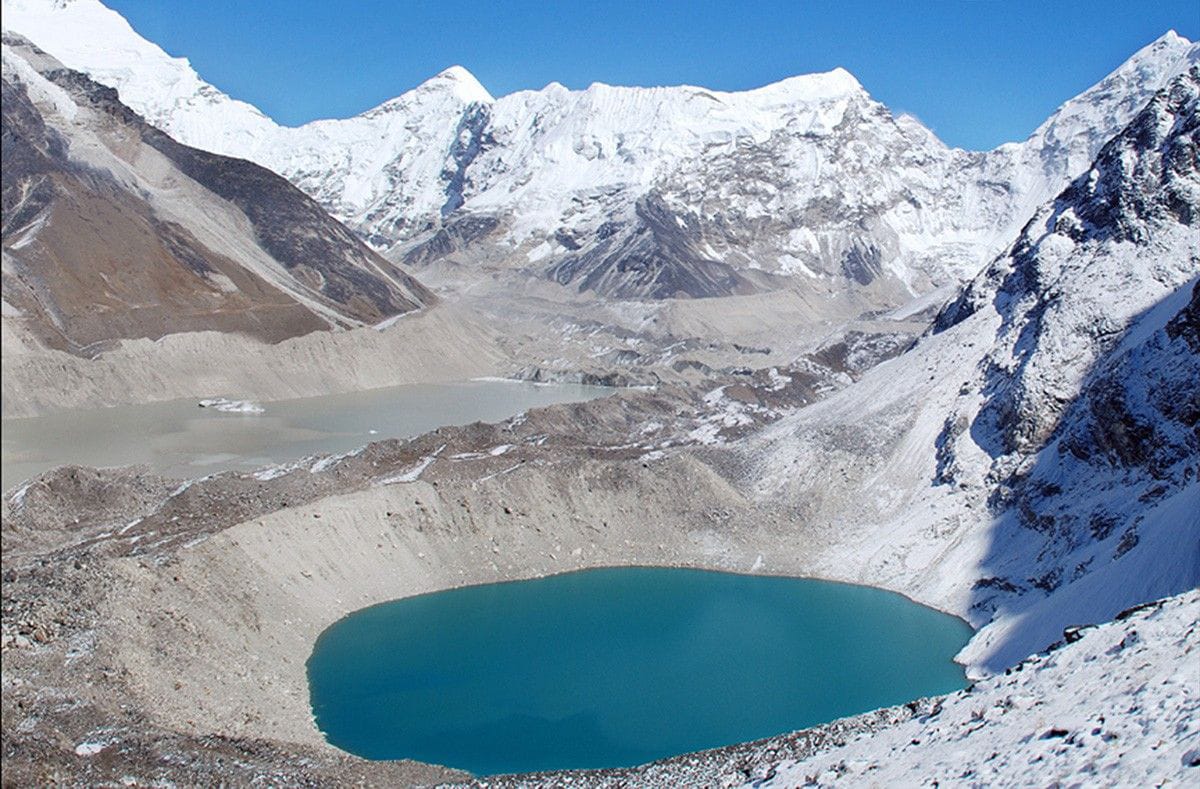
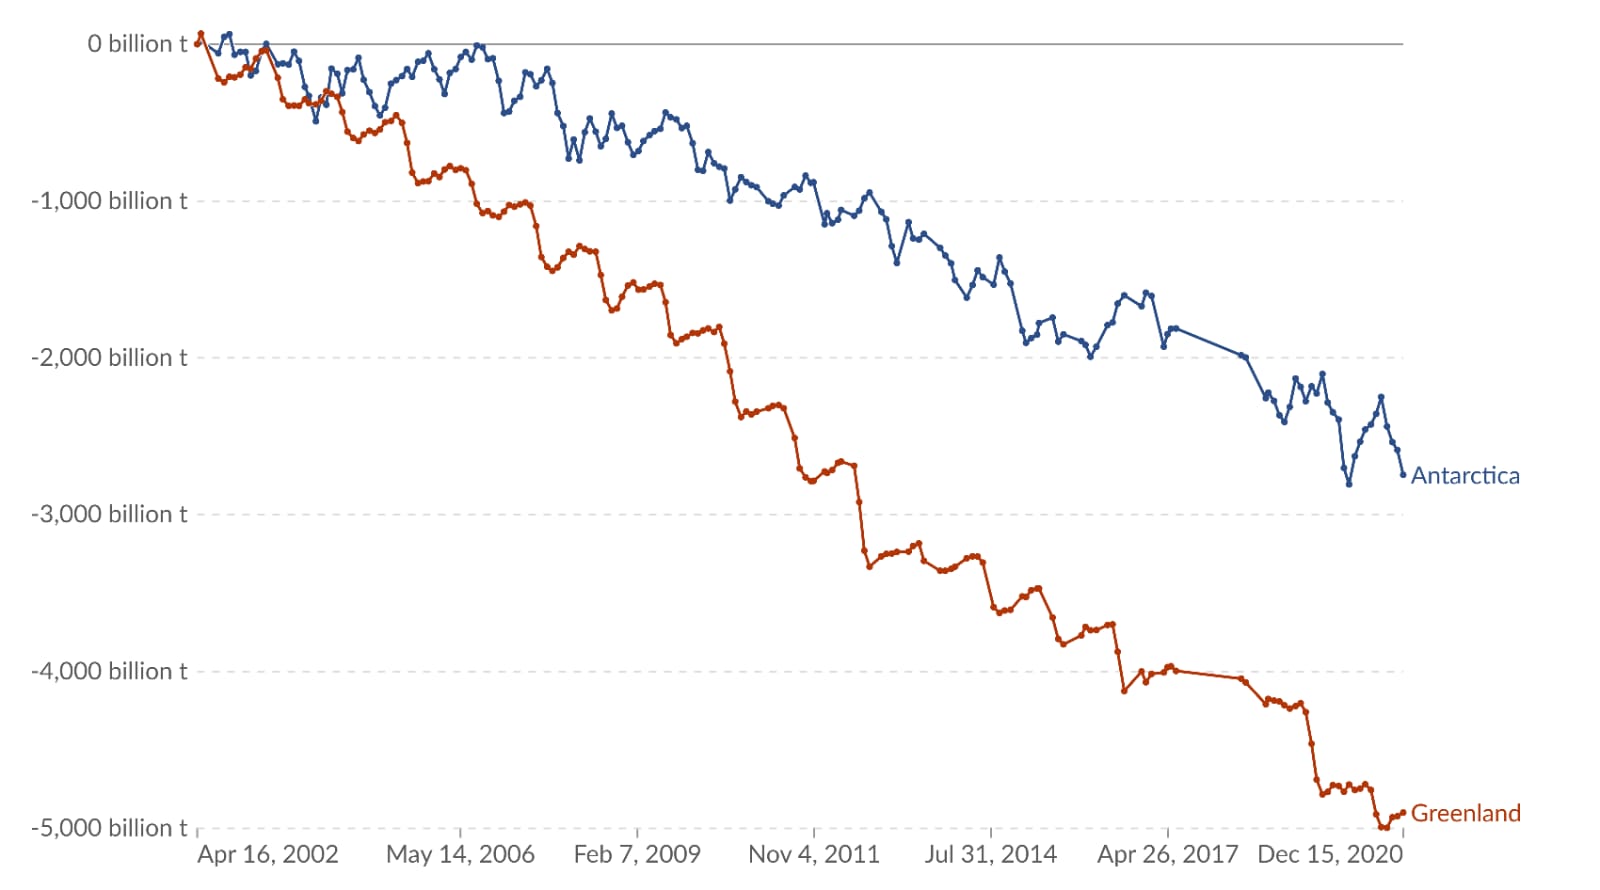
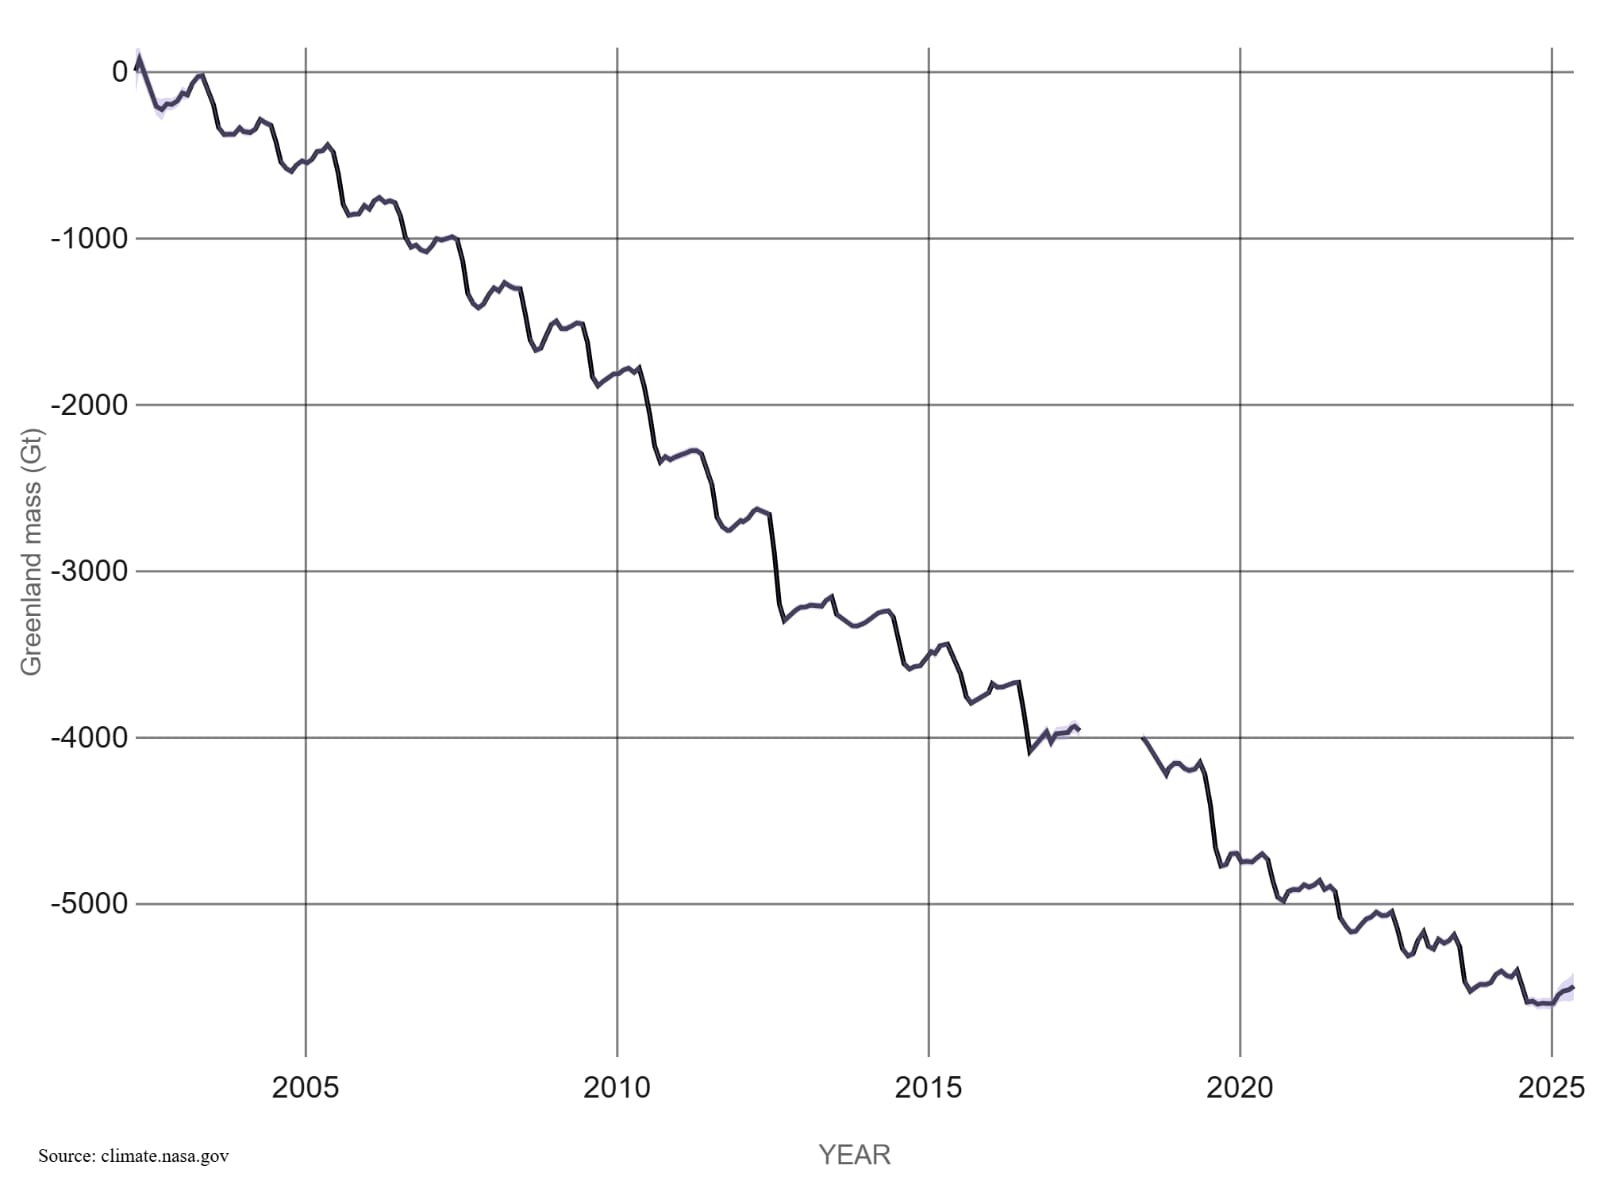
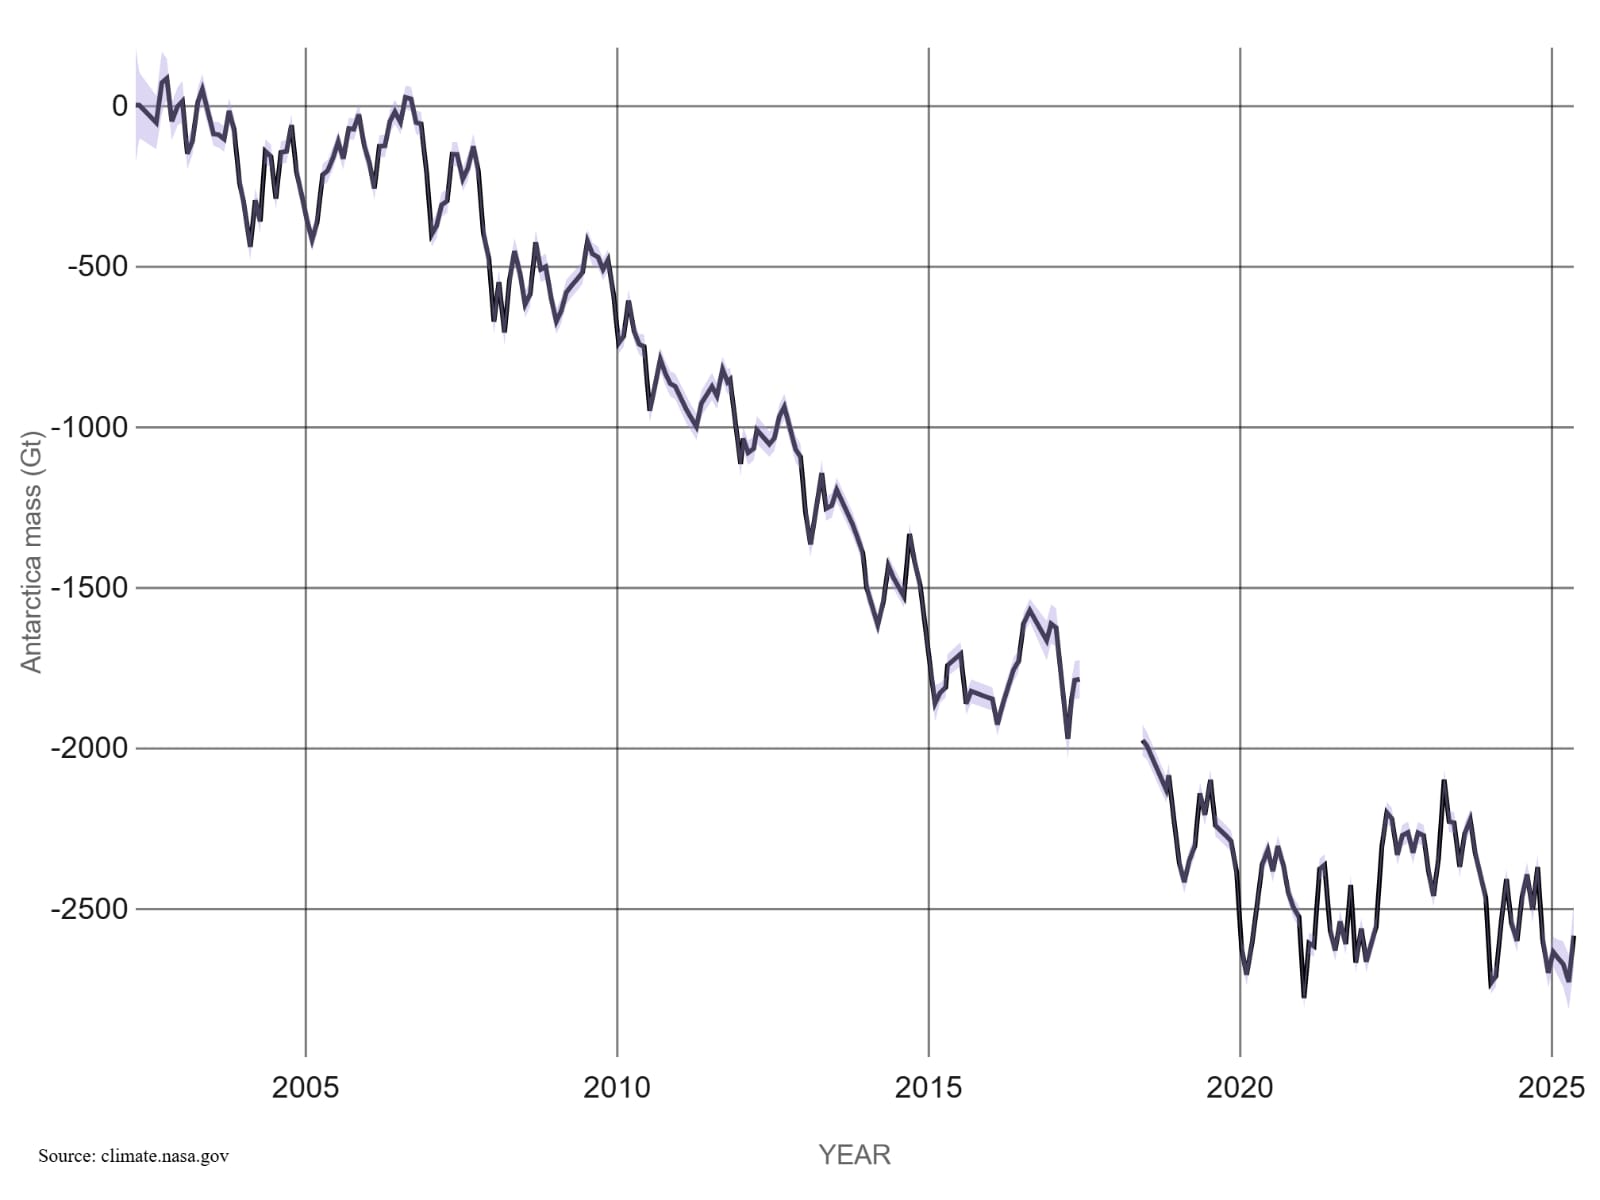
Ice sheets are massive, continent-scale bodies of ice covering Greenland and Antarctica. They store enough frozen water to raise global sea levels by many meters, and their accelerating melt is a major indicator of a warming planet.

THE NUMBERS:
  • Greenland and Antarctica together contain ~99% of Earth's freshwater ice
  • Greenland Ice Sheet is losing about ~266 billion tonnes of ice per year
  • Antarctic Ice Sheet is losing about ~135 billion tonnes per year
  • Combined ice sheet loss contributes ~1.2 mm per year to global sea level rise
  • Greenland melt alone raises sea level by ~0.7 mm per year
  • Ice sheet mass loss has quadrupled since the 1990s
  • Greenland ice loss has contributed ~20–25% of total sea level rise since 2000
  • Antarctica holds enough ice to raise sea levels by ~58 meters if fully melted
  • Greenland holds enough ice to raise sea levels by ~7 meters
12.2%
per decade
Rate of change per decade-June 2025 data

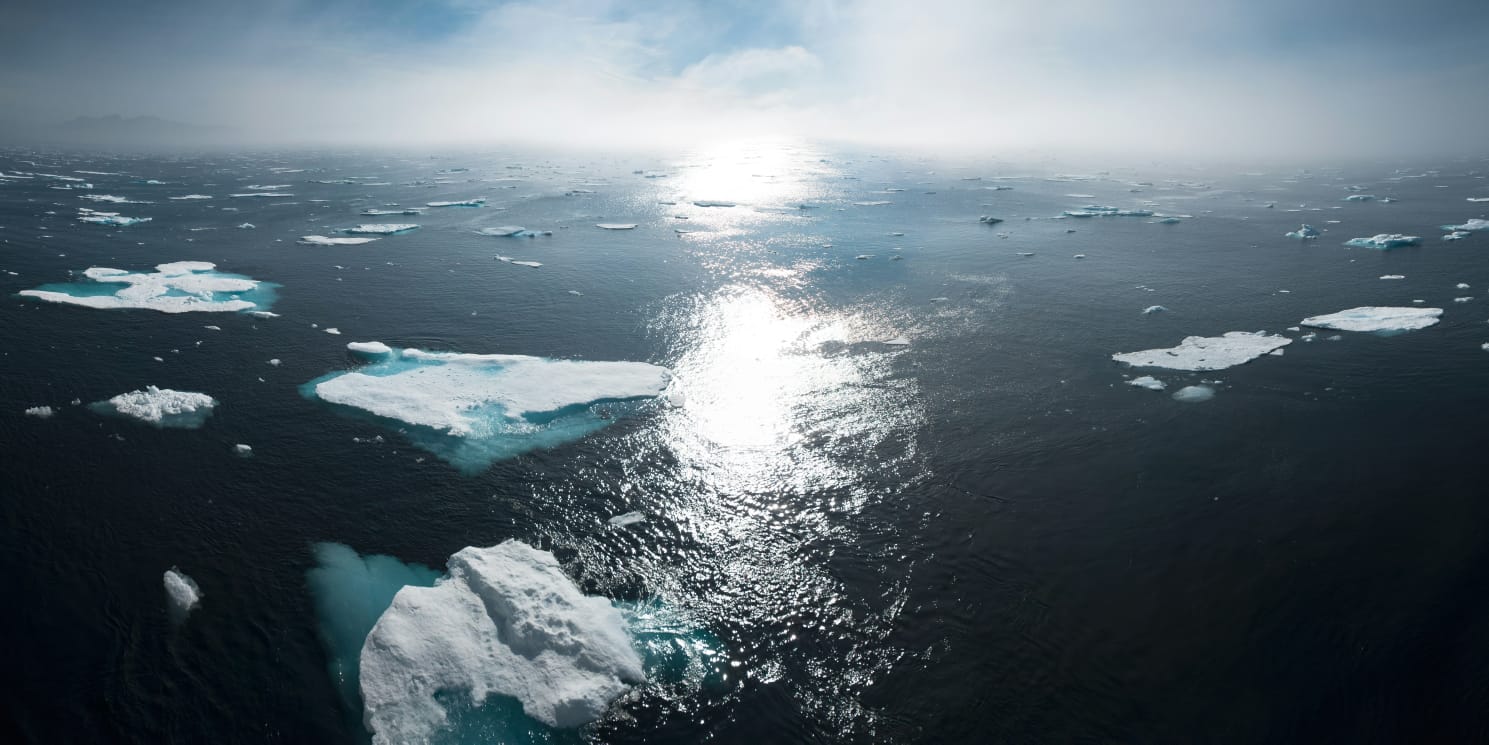
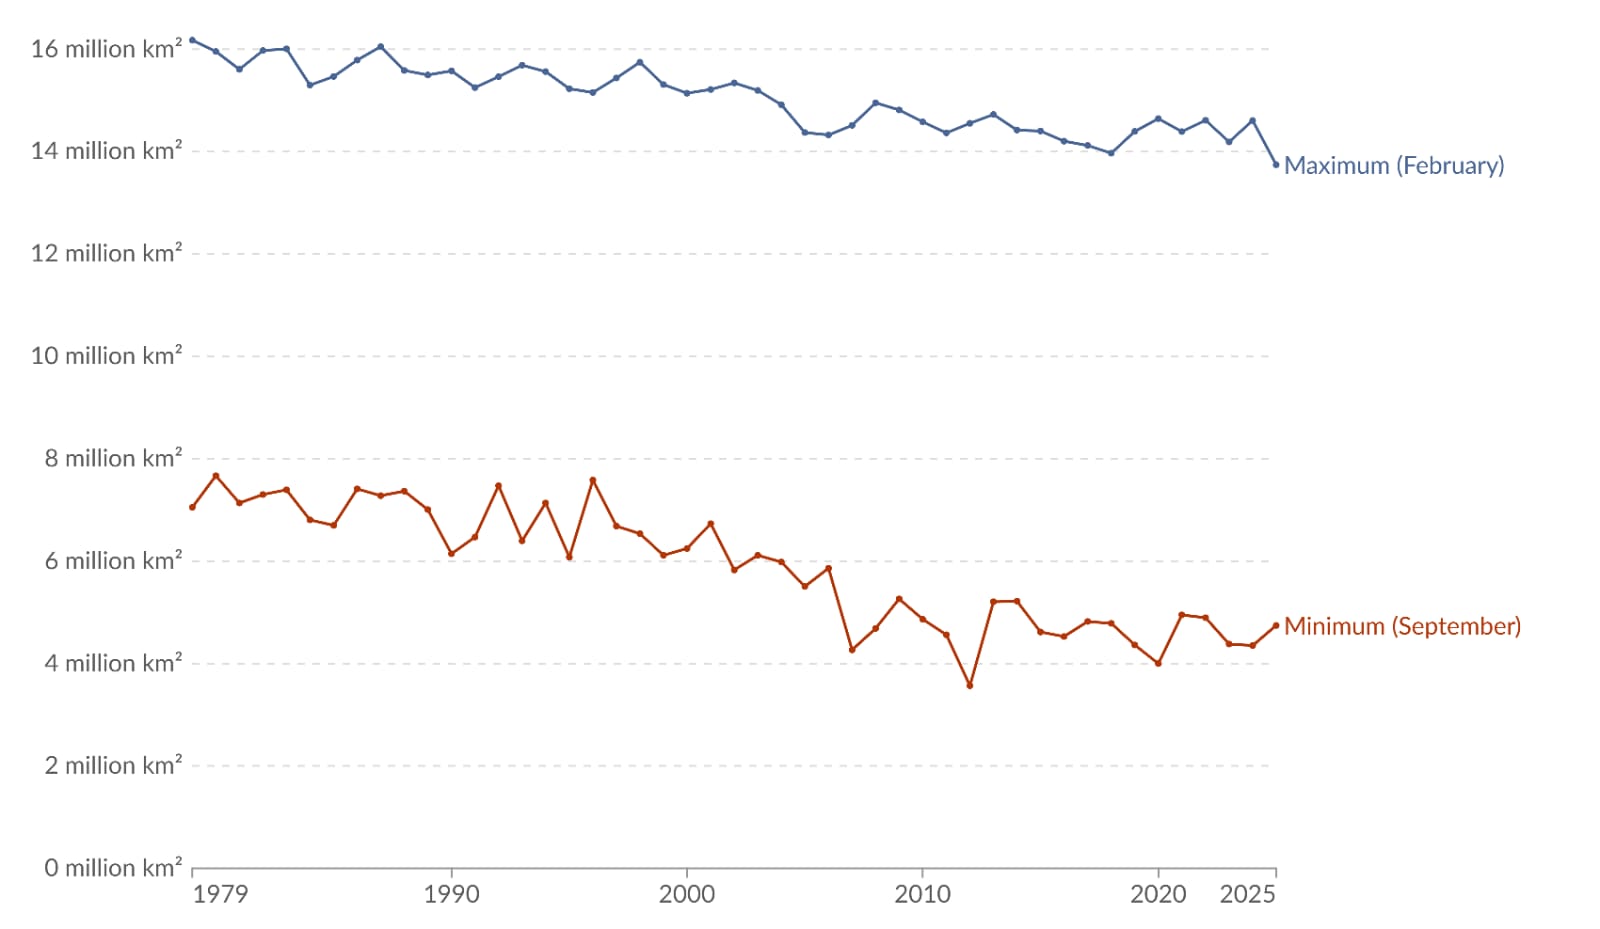
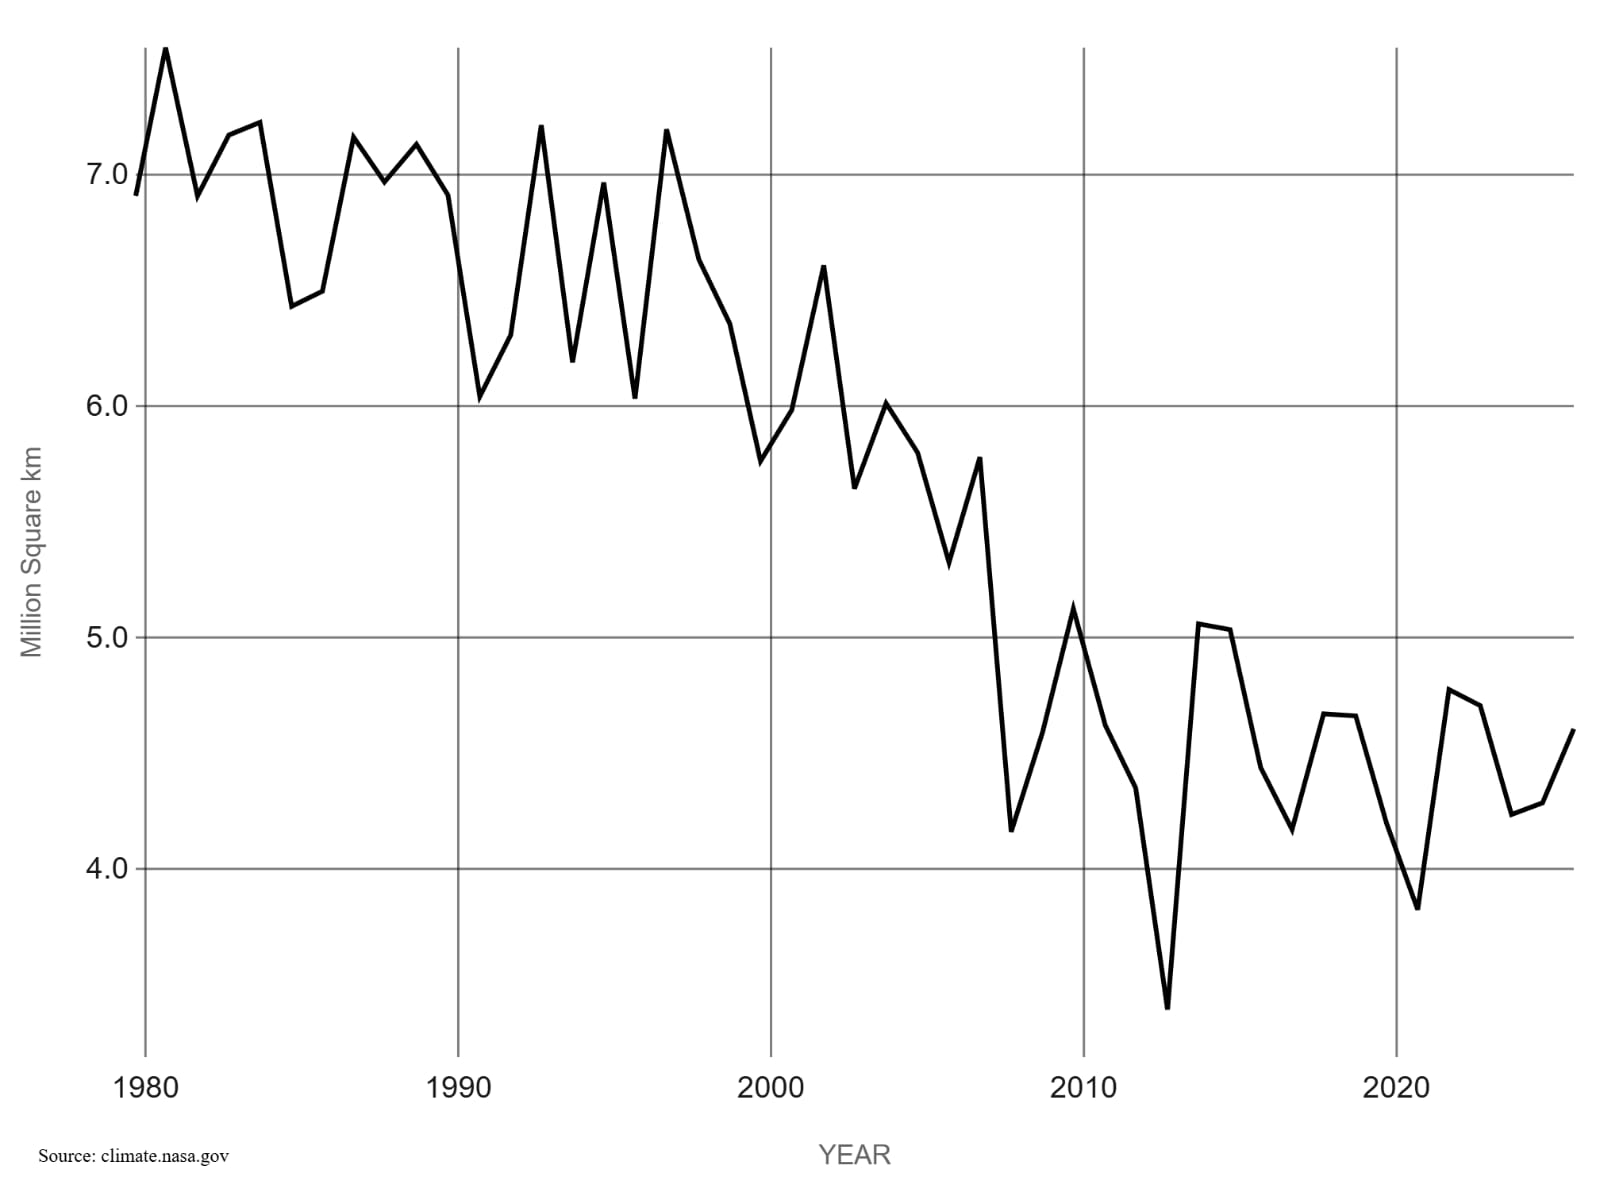
Arctic sea ice reaches its annual minimum each September. The rapid decline in this minimum extent is one of the clearest and fastest-moving indicators of global warming, driven by rising air and ocean temperatures and amplified by feedback loops.

THE NUMBERS:
  • Arctic summer sea ice has declined by ~13% per decade since satellite records began
  • 2023 minimum extent: ~4.2 million km², far below the historical average (NSIDC)
  • The lowest minimum on record was 3.39 million km² in 2012 (NSIDC)
  • Average September sea ice extent is now ~40% lower than in the 1980s
  • Arctic sea ice thickness has declined by ~65% since 1979
  • Multi-year (old) ice has dropped from ~60% to <30% of total ice cover
  • The Arctic is warming ~4× faster than the global average
  • Loss of sea ice accelerates warming via the albedo effect – dark ocean absorbs more heat
  • An ice-free Arctic summer is likely at ~1.5–2°C of global warming
91 MM
April 2026 data

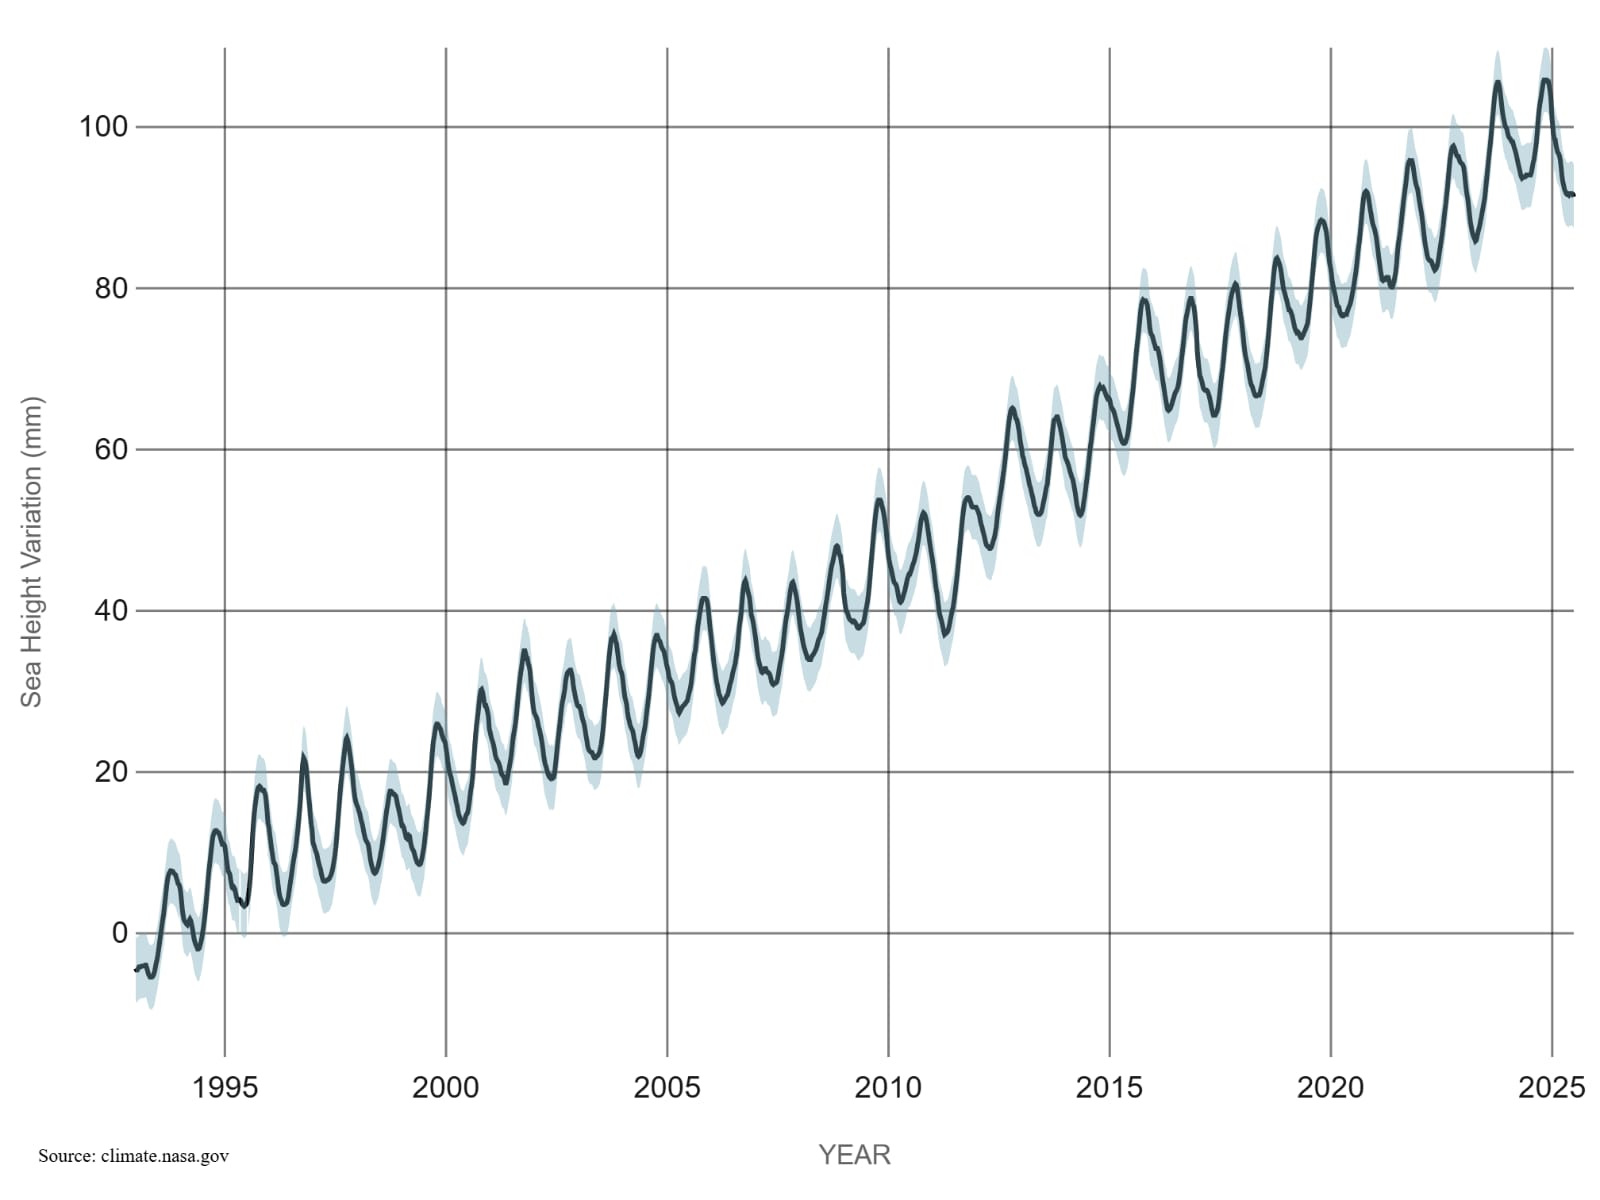
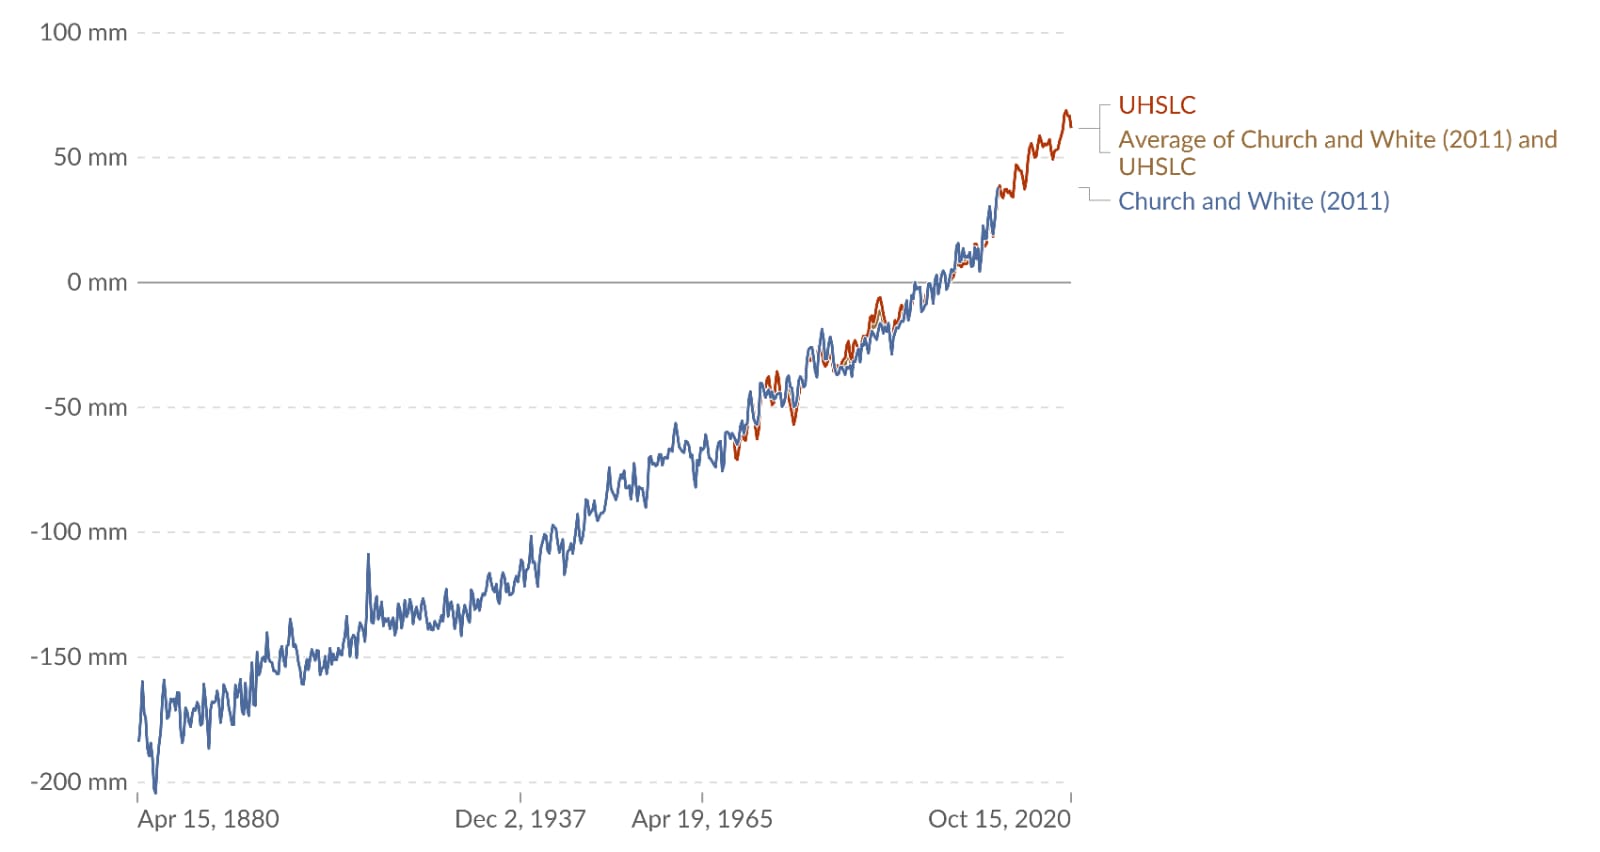
Global sea level rise is driven by ocean warming (thermal expansion) and melting glaciers and ice sheets. It is one of the most irreversible impacts of climate change, threatening coastal communities, ecosystems, and infrastructure worldwide.

The Numbers:
  • 91 (± 4.0) mm global mean sea level rise since 1993
  • Global mean sea level has risen ~20–25 cm (8–10 inches) since 1900
  • Sea level is currently rising at ~4.8 mm per year, accelerating over time
  • The rate of sea level rise has more than doubled since the early 20th century
  • ~50% of observed rise comes from ocean thermal expansion
  • The remainder is driven by melting glaciers, Greenland, and Antarctic ice sheets
  • Greenland alone lost ~250 billion tonnes of ice per year in recent decades
  • Sea level rise has accelerated since the 1990s, tracked by satellite altimetry
  • With 1.5°C warming, sea levels are projected to rise ~0.4–0.6 m by 2100
  • With high emissions, rise could reach ~0.8–1.0 m by 2100
  • Long-term warming commits Earth to multi-meter sea level rise over centuries
372 ZETTAJOULES
since 1955
2021 data

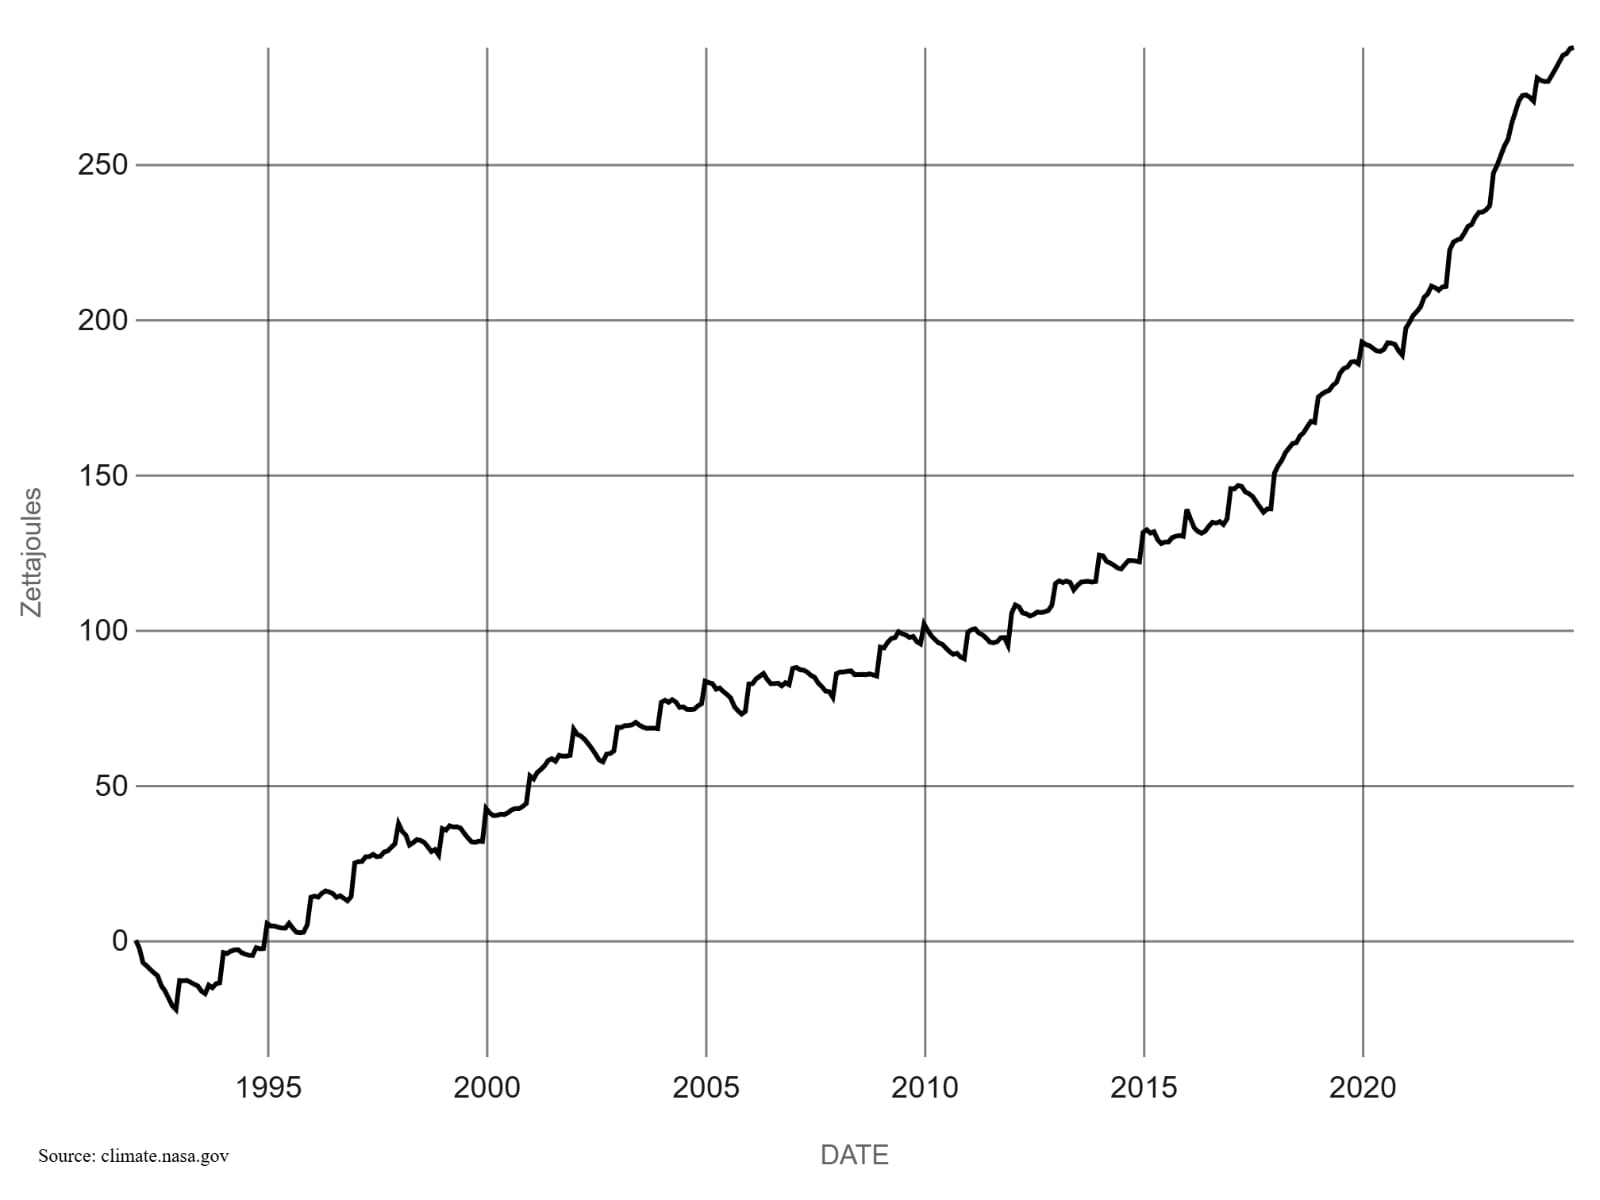
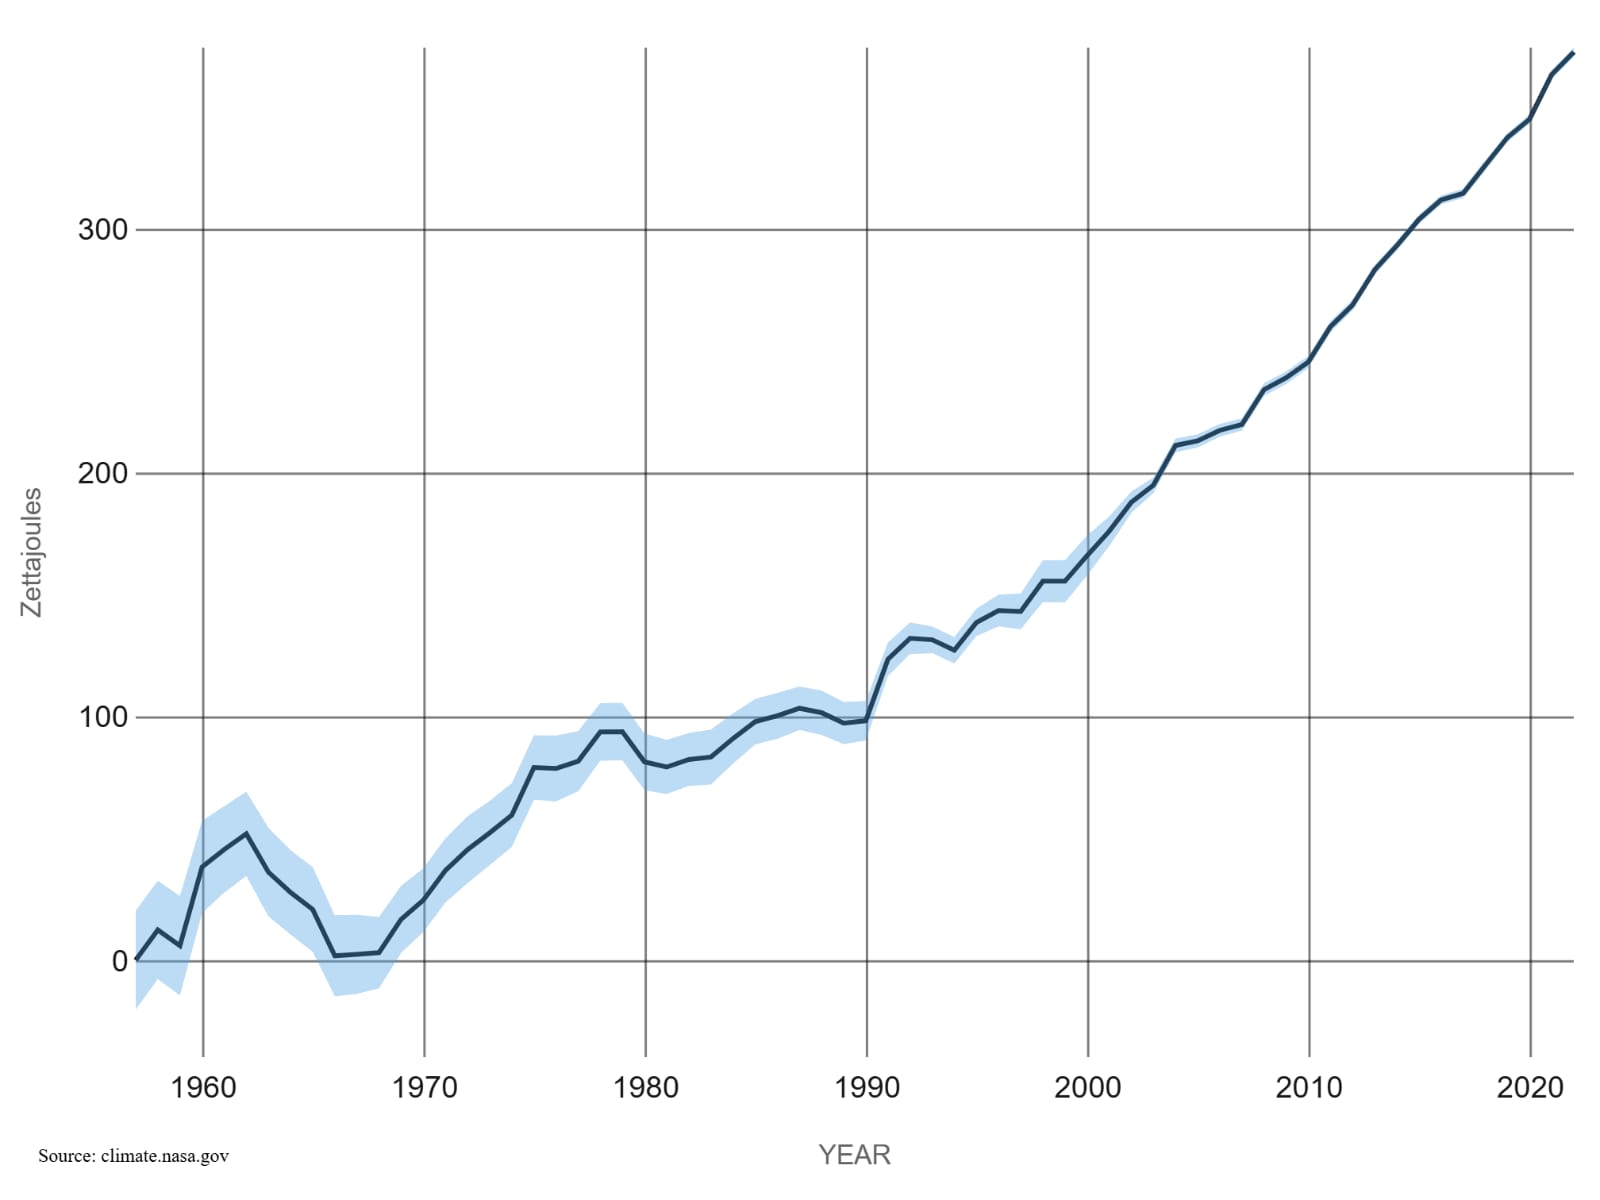
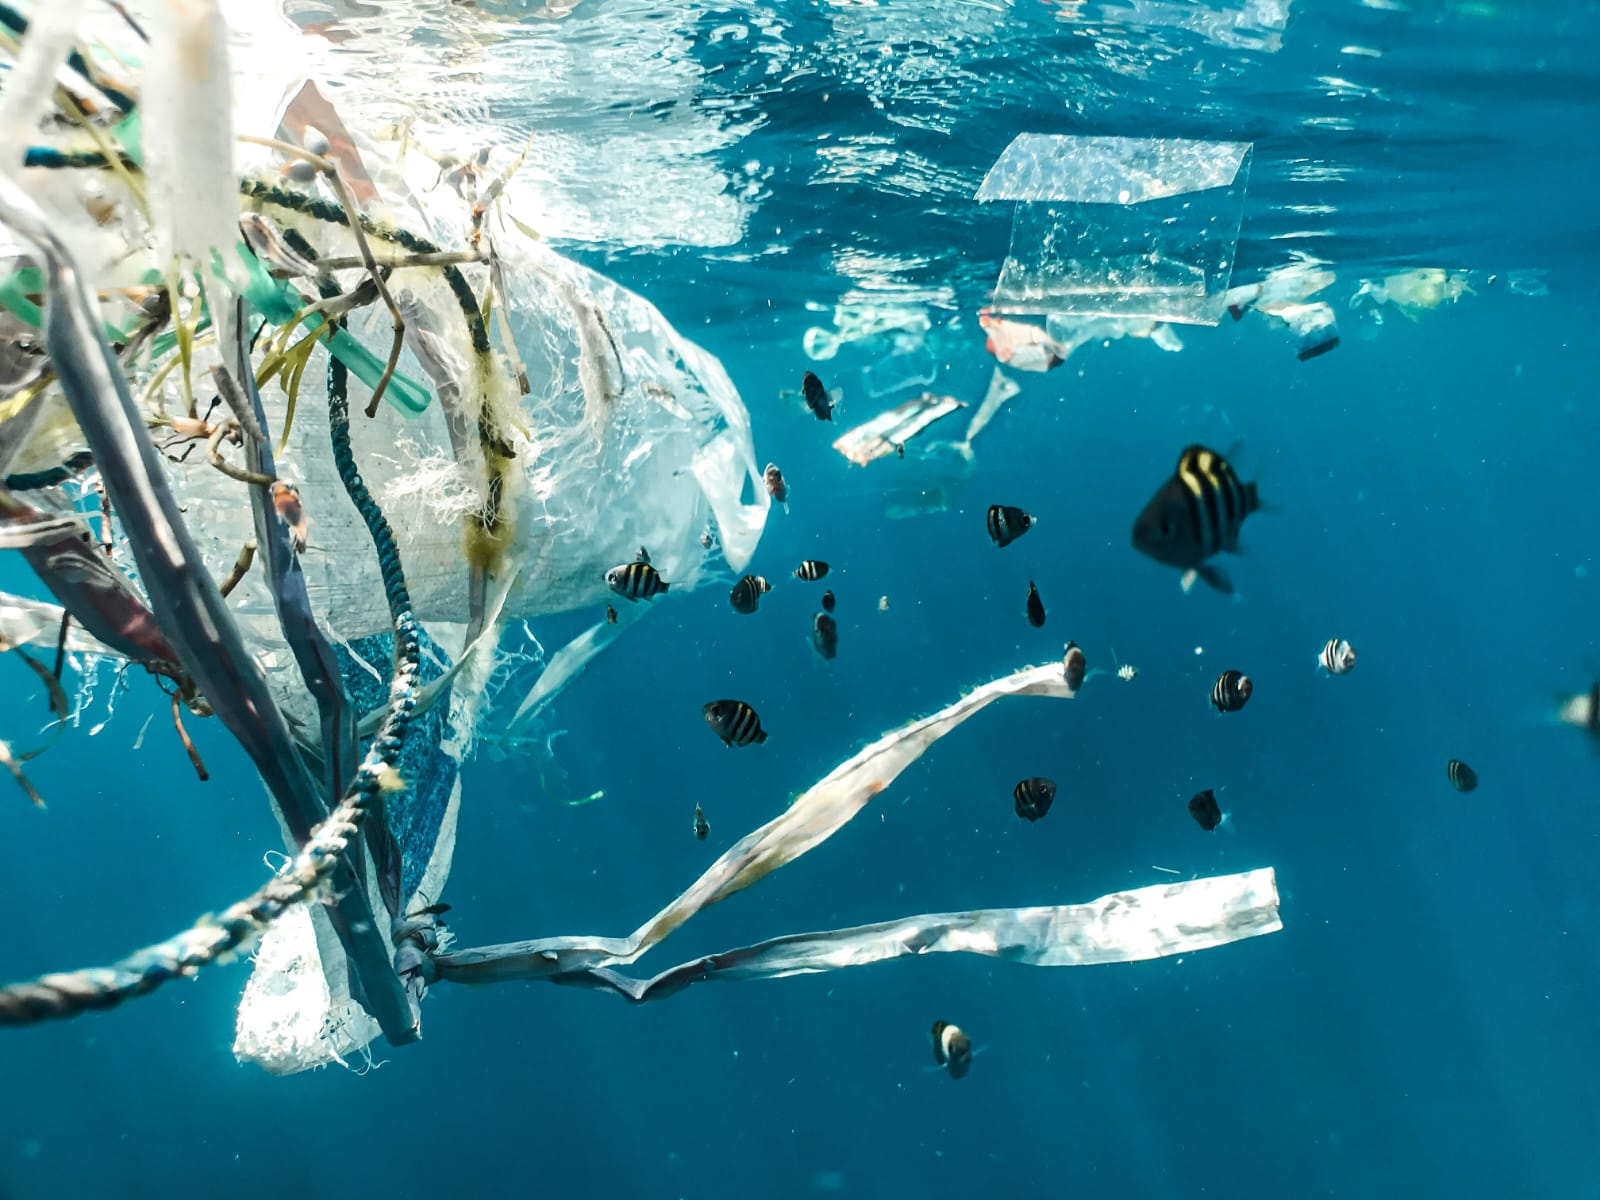
The ocean absorbs most of the excess heat caused by greenhouse gas emissions. This warming drives sea level rise, intensifies storms, disrupts marine ecosystems, and locks in long-term climate change.

THE NUMBERS:
  • 372 (±2) zettajoules of heat absorbed by the oceans since 1955
  • Oceans have absorbed ~90% of excess heat from global warming
  • Ocean heat content is at the highest level ever recorded
  • The upper 2,000 meters of the ocean are warming rapidly
  • Ocean warming has more than doubled since the 1990s
  • Global average sea surface temperature reached record highs in 2025
  • Ocean warming contributes ~50% of observed sea level rise via thermal expansion
  • Marine heatwaves have doubled in frequency since the 1980s
  • By 2100, oceans are projected to absorb 2–4× more heat under high-emissions scenarios

EXPLORE OUR WORK

ARTICLES ON CLIMATE CRISIS

Gallery